
Published on by Matthew H. Nash

Social media sites like Instagram are fundamentally altering the way we interact and engage with our world. We are more connected than ever, and the ability to share our lives can be great for keeping in touch with friends and family.
However, there is a darker side to social media. The way we interact with our digital spaces has come under scrutiny by many people who see dangerous trends becoming increasingly common.
For this study, we surveyed 1,233 active Instagram users located in the United States aged 18 to 40. The goal was to gain insight into how users interact with social media and the connection between engagement and risky behaviors.
While our survey was specific to the Instagram app, it's reasonable to draw conclusions about other social media sites such as TikTok, Facebook, Snapchat, and more when discussing high-risk behavior and social media validation.
In the process of conducting this survey, we also compiled the most comprehensive and up-to-date database of 399 selfie death incidents worldwide.
We asked our participants several questions about their Instagram use and risk-averse vs. risk-tolerant behavior to see whether we could identify patterns. Does a preoccupation with Instagram make someone more likely to engage in risky behavior for “likes”?
We want to know: Is a need for online validation actually making the real world more dangerous?

10% is a staggering number of people who have been or know someone who has been injured for social media. This percentage gets at the heart of what we wanted to discover with this study. The fact that social media is changing and shaping behavior is not surprising. But what is surprising is the lengths that people are willing to go to for “likes” and virtual engagement.
We asked our participants:
Have you ever gotten injured while taking a photo for Instagram or other social media?
And,
Do you know someone personally who has gotten injured or died while taking a photo for Instagram or other social media?
10% on average of those who had been injured or knew someone who had been injured is high, but this percentage rose dramatically for those who have over 1,000 followers: 20% of Instagram users with over a thousand followers know someone who has been injured or died or has personally been injured themselves while taking selfies for social media.

Age and gender also seem to play a factor. 14.5% of 18-to-24-year-olds know someone who has died or been injured or has been injured themselves for Instagram. 11.3% of men across all demographics know someone who has died or been injured, compared to 8.8% of women. Age is not a particularly surprising factor, as adolescents are historically prone to risky behavior, and the impact of social media on adolescent mental health and dangerous behavior is currently being evaluated by the psychiatric and scientific community.
Those who posted selfies more than once per week were more than twice as likely as the average person to know someone who had been injured or killed while taking pictures for social media and over three times as likely as the average person to have injured themselves while taking pictures for social media.
Additionally, those who had paid for followers were nearly three times as likely (27%) as the average person to know someone who had gotten injured or died while taking pictures for social media or having incurred injury themselves.
We asked our survey participants:
How likely are you to risk your safety while taking a photo of yourself or someone else if it meant you would be guaranteed to DOUBLE your current number of Instagram followers within a week of posting?
We wanted to format this question to capture a significant, but not unreasonably significant, increase in followers. One that would be consistent across all participants, as our survey participants ranged in follower counts from under a thousand to 50,000+.

Of the participants, 10% were likely or very likely to risk their safety while taking a photo of themselves or others to increase their Instagram followers. Those who indicated that they post a selfie at least once a week or more were 3.2x more likely to put themselves at risk for increased Instagram engagement.
Those with Instagram followings over 1,000 were significantly more likely to take potentially dangerous photographs. Women with over 1,000 followers were 2.2x more likely, and men with over 1,000 followers were 2.4x more likely to risk their safety for a bump in followers.
We asked survey participants:
In the past six months, how often have you posted a photo of yourself to Instagram?
The majority (45%) indicated that they post pictures of themselves a few times per month, 30% said never, 17% said more than once a month, 7% more than once a week, and 1% said they post photos of themselves daily. For that 8% who post more than once a week, we saw a sharp rise in risky behavior.

32% of those who post selfies once a week or more indicated that they would risk their safety to take a photo that would double their Instagram followers, and 30% said they would stand next to the edge of a cliff if it meant doubling their Instagram following. Over 27% of participants who posted selfies at least once a week indicated that they themselves have been injured or they know someone who has been injured or died while taking pictures for Instagram.

We asked survey participants:
How likely are you to stand near the edge of a cliff for a photo of yourself or someone else if it meant you would be guaranteed to DOUBLE your current number of Instagram followers within a week of posting?
Deaths related to falling off cliffs and other scenic landmarks are becoming increasingly common thanks to risky behavior associated with social media. We wanted to ask our participants to gauge their likelihood of participating in this kind of risky behavior if it would mean a bump in Instagram followers.

Of the participants surveyed, an average of 13% indicated that they were likely or very likely to stand on the edge of a cliff to increase their Instagram followers. Instagram users who posted selfies at least once a week were 2.3x more likely than average to engage in this behavior.
28% of women with over a thousand Instagram followers and 26% of men with over a thousand followers indicated that they would stand next to a cliff for a photo, which are both over twice as likely as the average participant. In fact, throughout the entirety of the survey, risk-taking behavior was often associated with higher follower counts, though we don’t infer causation.
We asked survey participants:
Have you ever paid for Instagram followers?
The willingness of our participants to pay real-world money for Instagram followers interested us in terms of how it impacted their risk-tolerant behaviors. Are the people who spend money on their social media following more likely to engage in riskier behaviors to boost their social media validation?
Only 4% of those surveyed admitted to paying for followers, but of that 4%, we found some interesting things. Men and women were pretty equally split on Instagram follower purchases overall, with women purchasing Instagram followers 4% of the time and men purchasing them 3% of the time.
Those with over a thousand followers were 2.25x more likely to have bought Instagram followers, and women with over 1,000 followers were 2.75x more likely to have purchased Instagram followers.
Of those who have paid for Instagram followers, they were twice as likely as average to know someone who has been injured or died while taking a photo for Instagram or social media.
Surprisingly, those who made under $10,000 annually were twice as likely as the average to have paid for followers on Instagram.
We asked survey participants:
How likely are you to travel to a location specifically to get an “Instagrammable” photo?
We were curious to see what lengths our participants are willing to go for social media engagement. Would they be willing to travel or even just take a road trip somewhere for a nice picture? And if so, what does this mean for Instagram behaviors?
36% of overall participants indicated that they were likely or very likely to travel to a location specifically to get a photo for Instagram. This was pretty consistent across genders, with women indicating 37% likely or very likely, and men indicating 35% likely or very likely.

Those who post selfies at least once a week were almost twice as likely as the average participant to travel for an Instagrammable photo. This is an insightful look into how social media is shaping our time and approach to leisure activities and how we spend our expendable income.
We asked survey participants:
How much do you agree or disagree with this statement, “I feel a rush when I receive more likes than average on my Instagram photos”?
61% of participants said they agree or strongly agree with the idea of feeling a rush when they receive more than the average amount of likes on Instagram photos. This is unsurprising since social media is literally engineered to increase dopamine production.

Women with over 1,000 followers and those who had paid for followers (of both genders) were the most likely demographic to feel a rush when they received more than average likes at a staggering 81%.
We asked survey participants:
How likely are you to change your current career path if you could earn a full-time income posting photos of yourself as an “Instagram Influencer”?
43% of our survey participants indicated that they were likely or very likely to leave their current career path if they could become a social media influencer full-time who specializes in selfies and self-promoting photography.

The participants with more Instagram followers were the most likely to choose a social media influencer career path over their current one. 67% of men and 60% of women with over a thousand followers indicated they would become full-time influencers.
Interestingly, those who identified as students were the least likely to choose this career path if it were offered to them, at only 34%.
TikTok, Instagram, Facebook, Snapchat, and other social media sites are fundamentally changing how we relate to each other and how we live our lives. Academics and safety professionals are recognizing and analyzing this trend, as well as calling for public safety measures like "No selfie zones" and increased safety measures and education.
If you're interested in learning more about the devastating impact of selfie culture, check out our comprehensive Global Selfie Death Database.
Published on by Matthew H. Nash
One crucial factor when planning an international trip is safety. From homicide rates to natural disaster risk, some countries pose a greater threat to safety than others. Our research team crunched numbers on seven safety risk factors for 50 of the most-visited countries to create our "Travel Safety Index."
Stay in the loop with our cutting-edge data analyses
The 50 countries included in our study were selected based on how popular they are among tourists. To determine the deadliest places in the world for tourists, we looked at the following ranking factors:
Please note: Due to ongoing conflicts in the region, Russia and Ukraine were omitted from the study.
1. Homicide Rate (0-100 points) - The number of intentional homicides per 100,000 people.
Source: United Nations Office on Drugs and Crime
2. Road Traffic Death Rate (0-100 points) - The estimated road traffic death rate per 100,000 people.
Source: World Health Organization
3. Poisoning Death Rate (0-100 points) - The mortality rate attributed to unintentional poisonings per 100,000 people.
Source: World Health Organization
4. Unsanitary Conditions Mortality Rate (0-100 points) - The mortality rate that is attributed to unsafe sanitation, unsafe water, and a lack of proper hygiene per 100,000 people.
Source: World Bank
5. Life Years Lost Due to Communicable Diseases (0-100 points) - The number of life years lost due to infectious diseases (adjusted for disabilities) per 100,000 people.
Source: Our World in Data
6. Life Years Lost Due to Injury (0-100 points) - Age-standardized and disability-adjusted life years lost due to injuries (including conflict, violence, and self-harm) per 100,000 people.
Source: Our World in Data
7. Natural Disaster Risk (0-50 points) - An index created by the German non-profit Bündnis Entwicklung Hilft in partnership with the United Nations University Institute for Environment and Human Security, the WorldRiskReport scores countries based on the risk of a natural disaster such as earthquakes, floods, or cyclones as well as the ability of the country to handle a disaster should it occur.
Source: WorldRiskReport
An individual's exposure to risk while traveling largely depends on the type of travel they choose and which areas of a country they visit. For example, going to a destination and staying in an all-inclusive luxury resort will often carry significantly less risk of bodily harm than staying in an area known for high crime, injury, or natural disasters. It's impossible to account for every variable that a traveler may experience when analyzing countries as a whole. This study attempts to aggregate data, taking into account a variety of factors to determine a nation's overall risk profile.
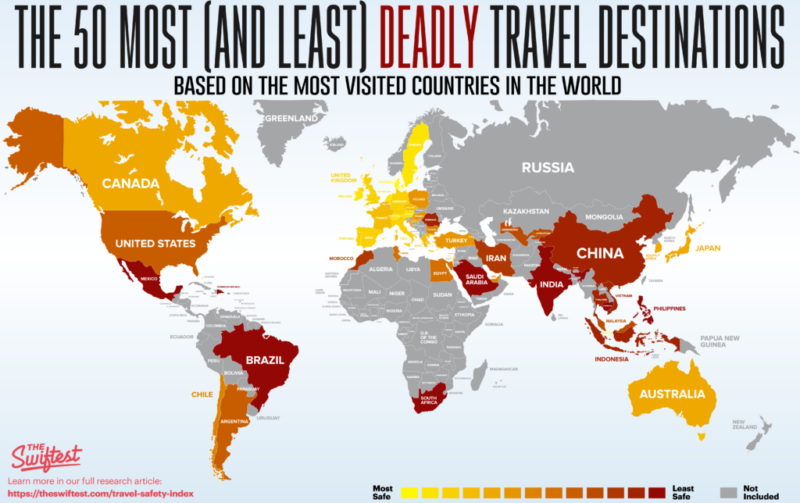
Below are the 20 deadliest travel destinations:
If you have a family or dependents, we recommend you consider researching the best term life insurance policies before planning a trip to a more "dangerous" destination. Keep in mind, some life insurance companies won't cover customers who visit places like Afghanistan, North Korea, Syria, Iraq, Parts of Africa (like Somalia or South Sudan), and Venezuela.

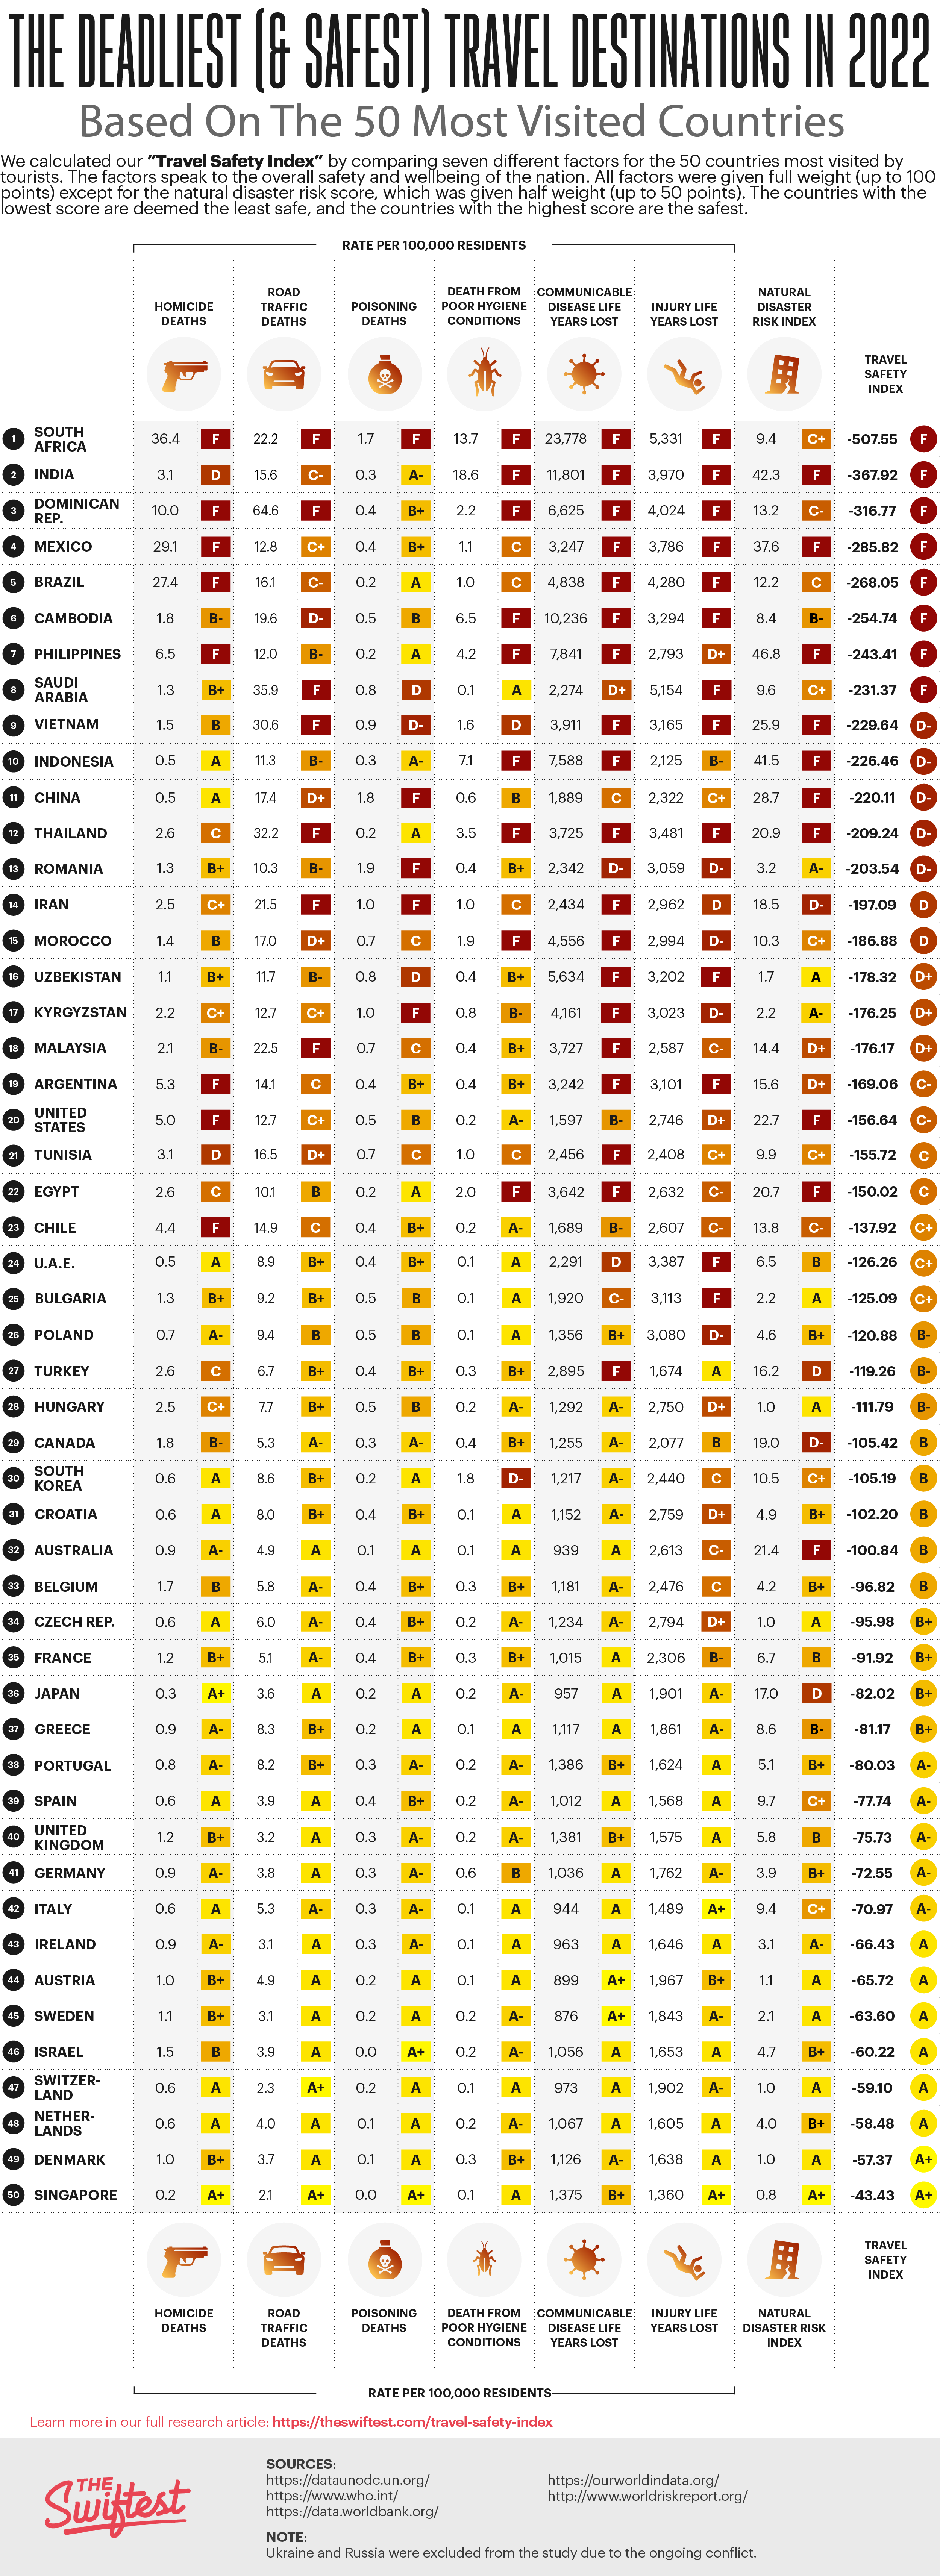
South Africa is a beautiful and exceptionally biodiverse country that attracts millions of international tourists each year. However, it also tops the list of the most deadly countries for tourists. Out of the 50 countries studied, South Africa has the highest homicide rate (36.4 per 100,000 people) and the highest number of life years lost due to communicable diseases (23,778 years per 100,000 people). The country also has the sixth-highest road traffic death rate (22.22 per 100,000 people).
South Africa scored an F in six of the seven factors used in our research study. The U.S. Department of State indicates:
"Violent crime, such as armed robbery, rape, carjacking, mugging, and 'smash-and-grab' attacks on vehicles, is common. There is a higher risk of violent crime in the central business districts of major cities after dark.
Demonstrations, protests, and strikes occur frequently. These can develop quickly without prior notification, often interrupting traffic, transportation, and other services; such events have the potential to turn violent."
Approximately 68 people are murdered in South Africa every day. Why this occurs is a complicated question to answer, but many believe it boils down to the following reasons:
Other factors like the prevalence of easy access to firearms, alcohol abuse, unemployment, and corruption have also been cited as causes of the extremely dangerous crime and hazardous living conditions within South Africa.
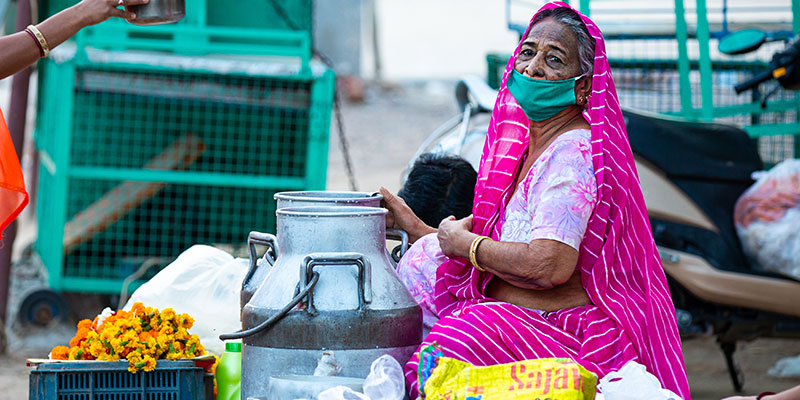
India is second on the list of most deadly countries for tourists. While the country has a relatively low homicide rate and poisoning death rate, it's the top country for deaths from poor hygiene conditions, at 18.6 per 100,000 people.
Not only is India extremely populated, but it also has extreme income inequality, with a massive gap between the country's richest and poorest citizens. This wealth gap means that many of India's over 1.3 billion people live in poverty and dangerous living conditions, with an estimated 60% of its citizens surviving on little over $3 a day.
Aging or inadequate infrastructure, substandard health, and sanitation conditions are just some of the issues that Indians face on a daily basis, with the lowest classes being forced to navigate the worst of it.
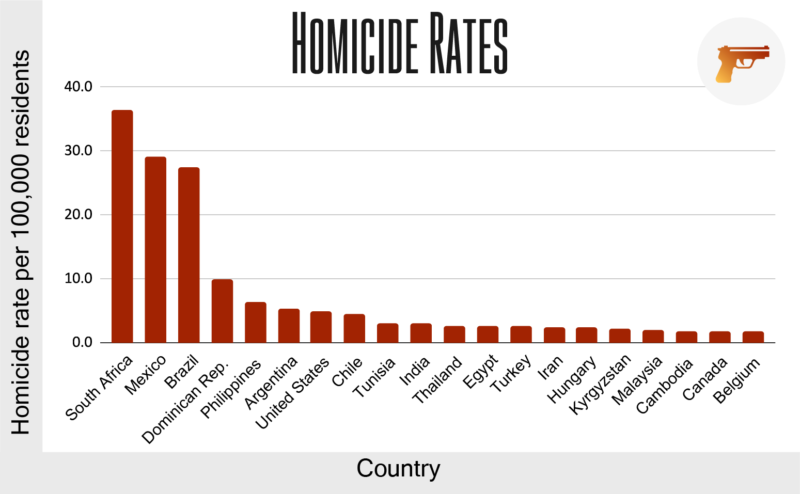
South Africa has the most documented incidents of homicide by a relatively large margin, with 36.4 homicides per 100,000. Mexico, the country with the second-highest homicide rate, has 29.1 homicides per 100,000, and Brazil has 27.4 homicides per 100,000. The homicide rate drops significantly from there, with the remaining countries reporting 10.00 or fewer per 100,000. Notably, the U.S. has the 7th-highest rate of homicide when compared to these 50 countries.
The countries with the highest homicide death rates are:
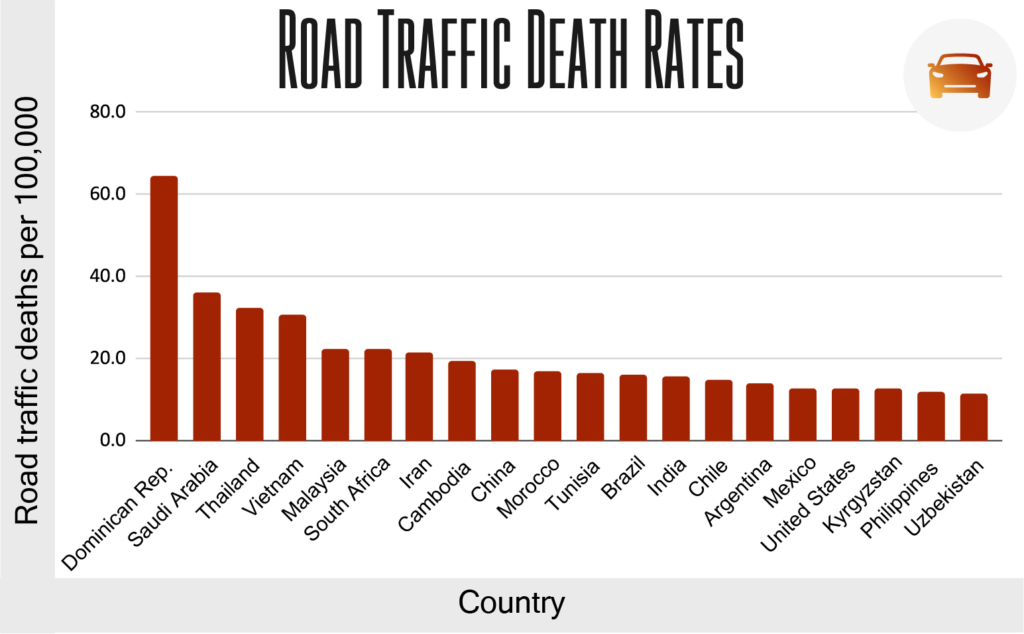
Vehicle transportation is unavoidable for most travelers, and unsafe road conditions can provide a considerable safety hazard in many countries. According to the CDC, 1.35 million people globally are killed in motor vehicle accidents every year, making this a real danger and a serious consideration when traveling to countries with more lax driving laws and poorly maintained infrastructure.
The Dominican Republic has a road death every two hours, which accounts for a significant portion of Dominican Republic deaths per year. Reasons for the dangerous road conditions are attributed to "a lethal mix of alcohol, speed and blatant disregard for traffic laws," according to The San Diego Union-Tribune.
The countries with the highest road traffic death rates are:
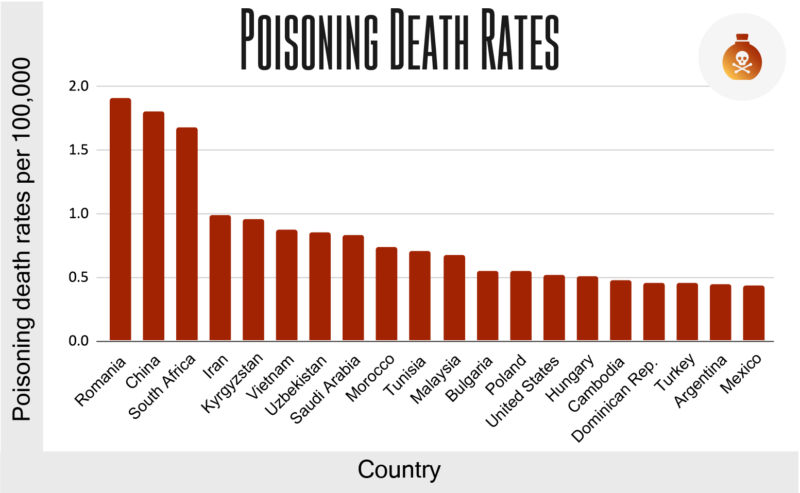
Romania, China, and South Africa are all outliers when it comes to poisoning deaths. According to one study by the NIH, China had 16,179 unintentional poisoning deaths in 2016, which made up 31% of the world's total of 52,077 poisoning deaths that year. The details and causes of poisoning incidents in China are scattered, which suggests these numbers may be underreported.
The countries with the highest poisoning death rates are:
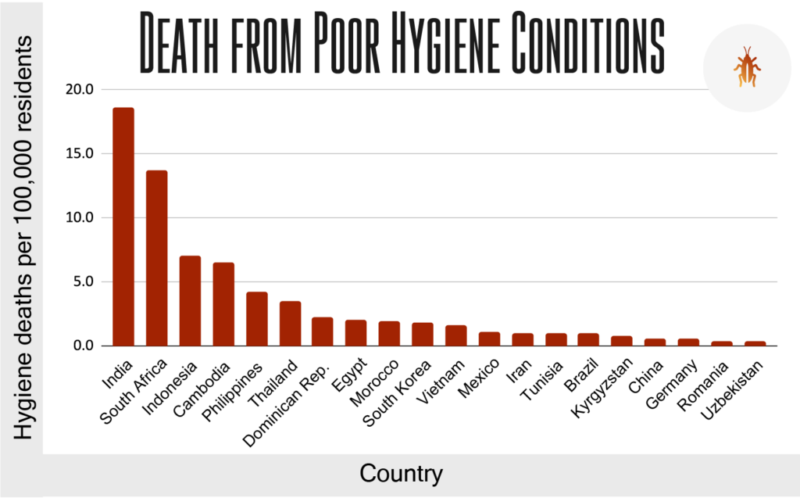
Anyone who has had traveler's diarrhea or another foodborne illness will know how vital sanitation is when it comes to a vacation. There are ways to prevent illness from unsanitary conditions, but it's not entirely possible to eradicate the threat of sickness in all regions.
While India is a developing country and is modernizing quickly, there's still much progress to be made in terms of general hygiene. An estimated one in ten deaths in India is attributed to poor hygiene conditions. Similarly, South Africa is having significant issues with clean water access and available sanitation services for its citizens, though this does appear to be improving.
The countries with the highest death rates from poor hygiene:
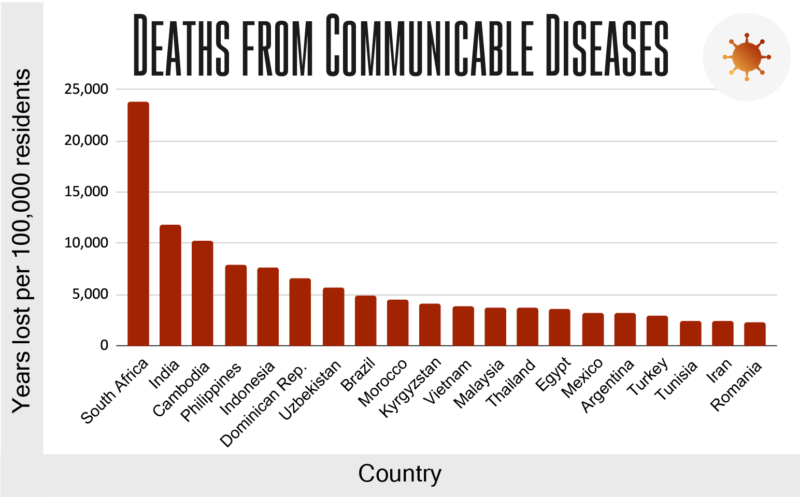
COVID-19 has shown us that infectious diseases are extremely serious, but many other diseases around the world also have devastating impacts and cause countless deaths every year. These include diseases like dengue fever, malaria, measles, cholera, typhoid, yellow fever, and more. It's always a good idea to check with your medical provider before traveling to a new region because they will have data available to ensure you are immunized against local diseases as much as possible and can take other preventative measures such as wearing insect repellent.
South Africa has over double the number of life years lost due to communicable diseases as India. Some of the diseases affecting South Africans include HIV, tuberculosis, respiratory infections, and more, according to the CDC.
The countries with the highest number of years lost from communicable diseases:
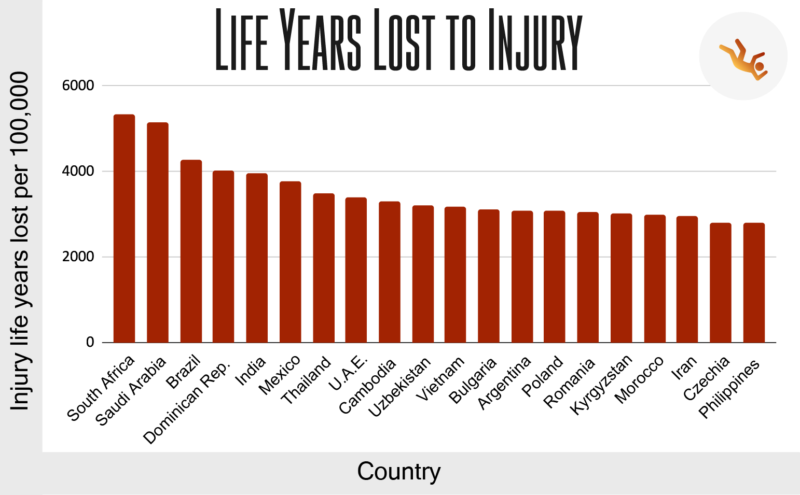
Injuries are an inevitable part of life. You can't prevent a broken arm or a sprained ankle anywhere in the world, but some regions are more prone to accidents or injury. This can be for various reasons, including infrastructure problems, inaccessible walkways, poorly maintained hiking paths, and much more.
South Africa has the highest years of life lost due to injuries, with many of those injuries coming from interpersonal violence and road traffic incidents. Saudi Arabia likewise reports many injuries, with most reported injuries affecting young males. These injuries were largely traffic-related.
The countries with the highest number of life years lost to injury are:
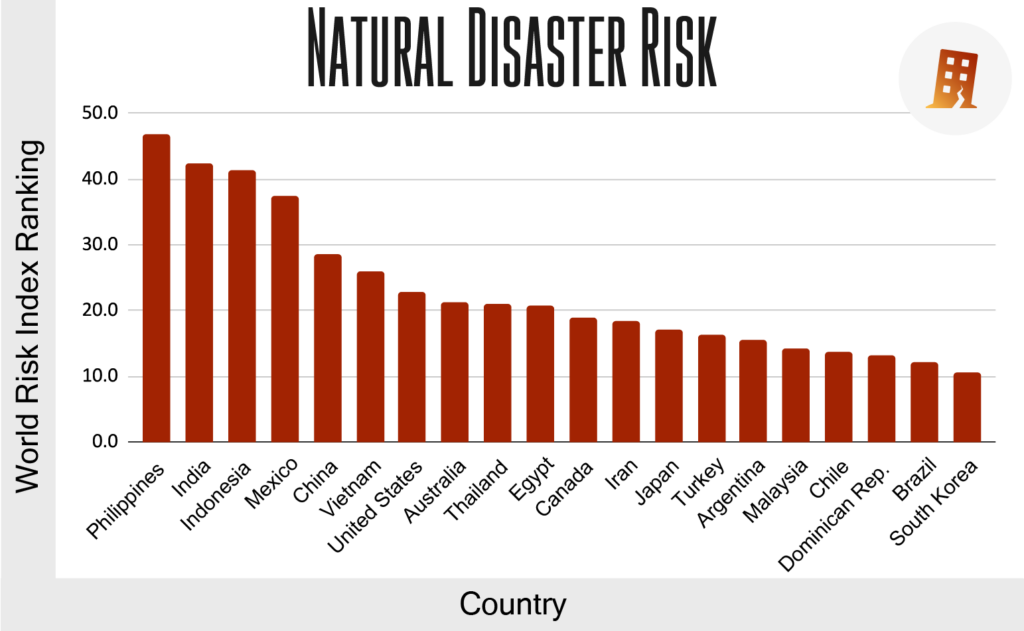
Natural disasters are increasingly becoming a regular part of our modern life due to the impacts of climate change, and it would be unwise to fail to consider the likelihood of natural disasters when picking a travel destination. Not only should the location be factored in, but also the season. For example, many countries have significant and deadly monsoon and hurricane seasons, which can threaten tourists and locals alike.
The most dangerous country when it comes to natural disaster risk and readiness response is the Philippines, according to the annual WorldRiskIndex. The Philippines garnered a score of 46.8. The second and third most dangerous countries are India and Indonesia, followed by Mexico and China. Notably, the U.S. and Australia ranked 7th and 8th, respectively.
The countries with the highest natural disaster risk:
Based on data for 50 of the most-visited countries in the world, these are the 20 safest countries for tourists and their Travel Safety Index scores:

According to our index, Singapore is the least deadly country for tourists. With a very low homicide rate, road death rate, and natural disaster risk, Singapore is an excellent choice for travelers in terms of safety.
What makes Singapore so safe? Well, crime does not pay in Singapore. The consequences for committing crimes in Singapore are incredibly high, even for "smaller" crimes. This, combined with high surveillance and police presence, makes Singapore the world's safest country for travel.
This, of course, doesn't mean you shouldn't still take universal safety precautions, even in Singapore. For some top travel safety tips, see the end of the article.
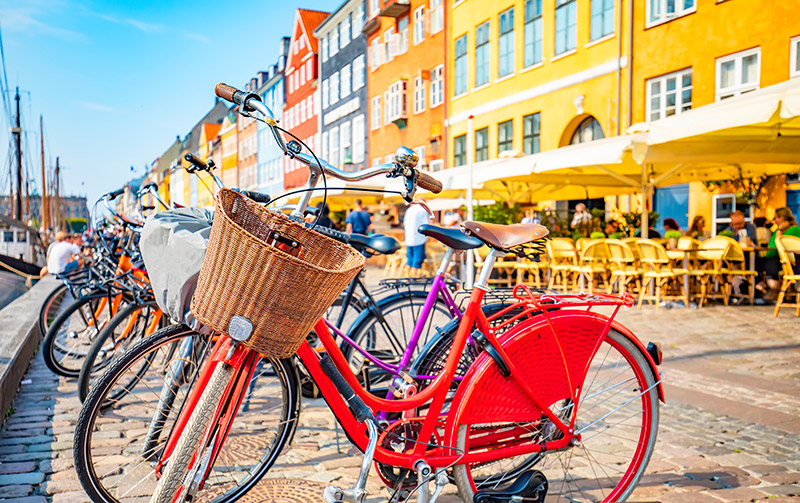
Denmark's high safety ranking likely won't come as a surprise to those familiar with Denmark's reputation. The low crime rate is often attributed to strong social safety nets that keep its citizens out of poverty, which decreases petty crimes like theft and pickpocketing. Denmark also has a robust police presence, a (relatively) transparent government, and high-quality technological surveillance, which makes Denmark an uncommonly safe place to live and travel.
This level of safety and community trust made Denmark go viral recently when people on social media discovered footage of Danish mothers and fathers leaving their newborns outside to sleep in their strollers while the parents go into shops and cafés. This is a common practice and is often believed to help babies and infants sleep comfortably and develop better immune systems. The idea of trusting the general public with an infant seems like madness in many other parts of the world. This goes to show the level of safety and transparency within Denmark.
Updated by Matthew H. Nash
Biodiversity is vital for our planet. However, over the past century, the world has seen an unprecedented decline in biodiversity triggered by climate change, habitat loss, overexploitation, pollution, and pesticides. Consequently, we decided to take a deep dive look at how nations rank in terms of biodiversity around the globe in 2022. The results of our research are presented in this in-depth "Global Biodiversity Index".
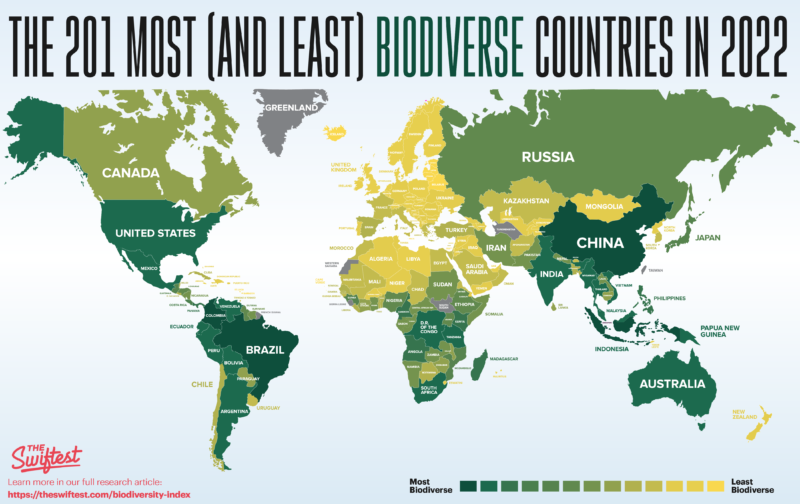
Learn more about the specific species breakdown for each country in the table below.

Stay in the loop with our cutting-edge data analyses
The 201 countries included in our study were selected based on available data. Unfortunately, some countries lack easy-to-find information about certain categories, particularly with vascular plants. We used a mixed-methods approach to our research design with the six ranking factors below to determine scores for each country that are indicative of their biodiversity.
1. Total number of bird species in each country (0 to 100 points) – To find the total number of bird species in each country, we consulted the BirdLife Data Zone. Their database indicates the total number of bird species, in addition to other pertinent information, such as endangered and extinction rates.
Source: BirdLife Data Zone
2. Total number of amphibian species in each country (0-100 points) – Data for each country’s number of amphibians was collected from AmphibiaWeb. For over twenty years, AmphibiaWeb’s team has been compiling information regarding the world’s amphibians for their database. We searched by country and pulled the data for our study.
Source: AmphibiaWeb
3. Total number of fish species in each country (0-100 points) – We obtained the number of fish species per country from FishBase’s database of almost 35,000 species.
Source: FishBase
4. Total number of mammal species in each country (0-100 points) – Mammal species per country data was sourced from the website Mongabay and supplemented with additional country-level academic journals and data as needed.
Source: Animalia
5. Total number of reptile species in each country (0-100 points) – The total number of reptile species per country was obtained from The Reptile Database.
Source: The Reptile Database
6. Total number of plant species in each country (0-50 points) – This data was obtained from Mongabay and supplemented by country-specific academic journals. Because of the inconsistent data that we found, this metric was given a half-weight of only 50 possible points.
Source: Various scientific and research sources
While we use what we believe to be the leading databases for the various plant and animal species in our study, it would be nearly impossible to definitively say exactly how many different species exist within each country. Many countries have conflicting data reports, underreporting, or simply lack reporting when it comes to the various species. Additionally, new species are being identified yearly, and others are dying out (at alarming rates).
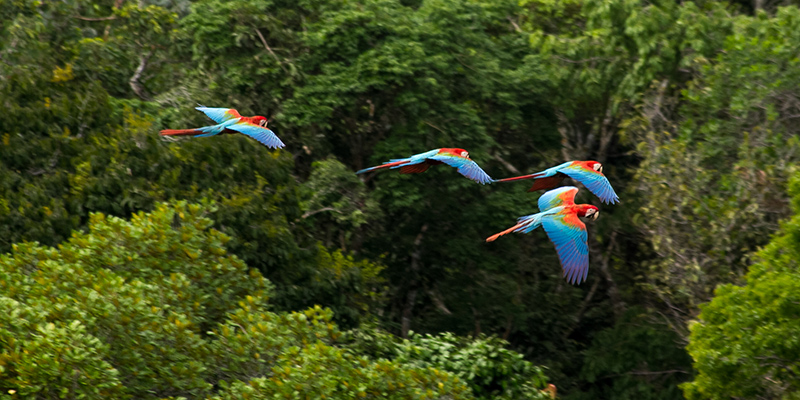
Based on our analysis, the following are the 25 countries where biodiversity is the highest, along with our biodiversity scores:
One interesting observation is that some of the most biodiverse countries are also the most populated. Additionally, many of the most biodiverse countries are sadly spending the least on conservation.
Brazil tops the list as the most biodiverse place on Earth. With 1,816 bird species, 1,141 amphibian species, 4,738 fish species, 693 mammal species, 847 reptile species, and 34,387 plant species, Brazil is one of 17 megadiverse countries. This term refers to any country that has a high number of native plant and animal species, as identified by Conservation International.
The 17 current megadiverse countries are Australia, Brazil, China, Colombia, Democratic Republic of the Congo, Ecuador, India, Indonesia, Madagascar, Malaysia, Mexico, Papua New Guinea, Peru, Philippines, South Africa, United States, and Venezuela.
Brazil is a massive country with an incredible amount of biological diversity. At nearly 3.3 million square miles, it is the fifth-largest country by size, but ranks first in biodiversity (by a lot). In fact, it is estimated to be home to up to 20% of the world’s total biodiversity, with new native species being discovered all the time.
According to our research, Brazil has approximately 43,622 plant and wildlife species, compared to the next most biodiverse country, Indonesia, which has approximately 27,662 species. This is very diverse but pales in comparison to the vastly biodiverse Brazil.

San Marino came in last in our study of biodiversity, with only 758 total plant and wildlife species. This tiny microstate certainly lacks a wide range of plants and animals. Why is this? The lack of diversity is due in large part to its small size. San Marino is the fifth smallest country in the world at only 24 square miles. Also adding to this lack of biodiversity is the fact that San Marino is entirely landlocked and does not have any lakes or bodies of water (hence its complete lack of fish species).
These are the top five countries with the highest number of each species included in our research.
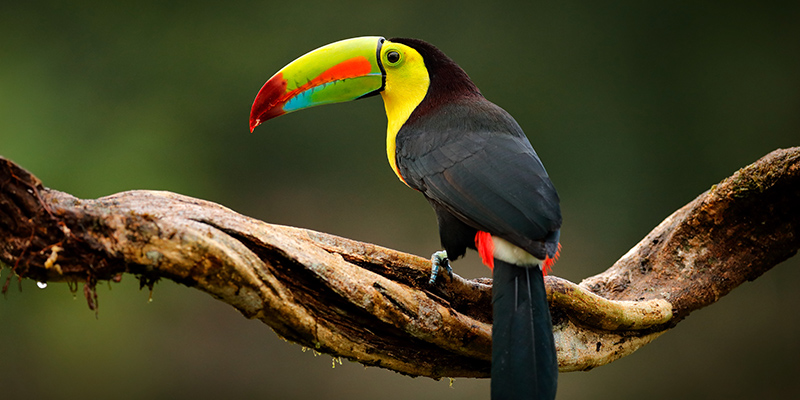
Bird watching is a popular hobby all around the world. With more than 11,000 species of birds globally, travelers enjoy finding and tracking beautiful and rare birds all over the world. For avian enthusiasts, these five countries are absolute must-sees:
1. Colombia: 1,863
2. Peru: 1,861
3. Brazil: 1,816
4. Indonesia: 1,723
5. Ecuador: 1,629
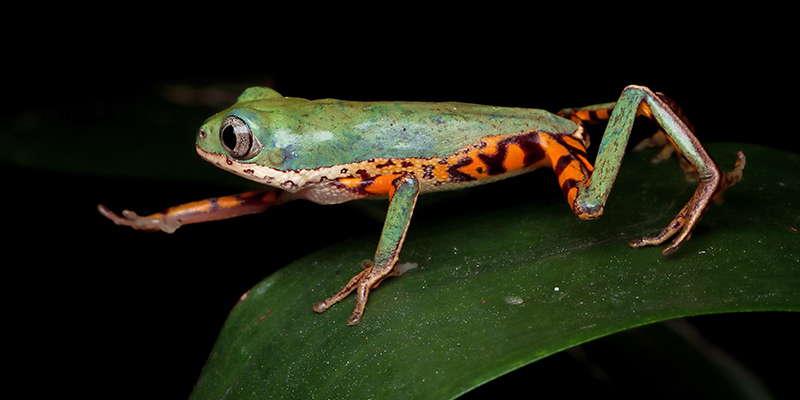
Amphibians like frogs, salamanders, and axolotls can be a lot of fun to find and watch. While they may not be as fun and exciting as birdwatching, many travelers still find amphibians fascinating. These five countries contain the highest rates of amphibian species:
1. Brazil: 1,141
2. Colombia: 812
3. Ecuador: 659
4. Peru: 655
5. China: 540
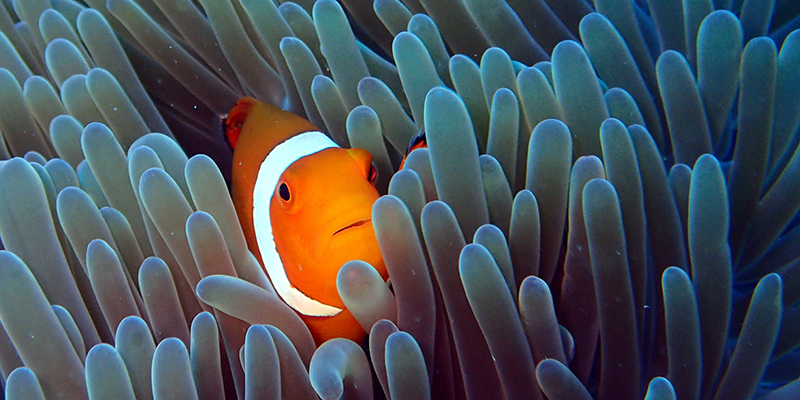
As aquariums and seafood restaurants can attest: people love fish. Whether it's the sport of catching them or simply enjoying their beauty in the wild, many travelers seek out aquatic dwellers during their holidays. These countries contain the most fish species:
1. Australia: 4,992
2. Indonesia: 4,813
3. Brazil: 4,738
4. Japan: 4,098
5. China: 3,476

Mammals, like lions, tigers, and bears, are often a big draw for tourists. There are estimated to be over 10,000 zoos worldwide, as well as countless wildlife and safari tours dedicated to observing mammals in their natural habitats. These five countries have the highest number of mammal species in the world:
1. Indonesia: 729
2. Brazil: 693
3. China: 622
4. Mexico: 533
5. United States: 531

Countries like Australia are renowned for their diverse ecosystems thriving with reptile species. If crocodiles, snakes, lizards, and turtles are more your style, these five countries will be great travel destinations where you're bound to see some interesting fauna:
1. Australia: 1,131
2. Mexico: 988
3. Brazil: 847
4. Indonesia: 773
5. India: 715

Not surprisingly, Brazil comes in the #1 spot. The Amazon rainforest has long been referred to as the “lungs of the earth” since the incredibly diverse plant species are constantly sequestering carbon and producing oxygen. Botanists and plant hobbyists will love the following countries for their wide array of diverse flora:
1. Brazil: 34,387
2. China: 31,362
3. Venezuala: 30,000
3. Colombia: 24,025
4. Mexico: 23,385

Our planet is currently experiencing a great loss of biodiversity. According to the World Wildlife Fund, the loss of species we are experiencing today is estimated to be between 1,000 and 10,000 times greater than the natural extinction rate. While we don’t know exactly how many species of plants and animals are out there, a low estimate is that we could be losing 200 to 2,000 species every year, while a high estimate is between 10,000 and 100,000 species.
These are some of the biggest threats to biodiversity:
Biodiversity offers a variety of benefits to our planet. Most importantly, plant and animal species support the ecosystems we rely on. They aid in pollination, soil fertility, food and medicine production, air quality, and much more. Losing too many species would negatively affect the balance of our world.
Research has shown that the degeneration of wildlife could lead to more disease outbreaks. As humans travel deeper into nature, we increase our risk of exposure to pathogens carried by wild animals. Many recent viral disease outbreaks can be traced back to wildlife.
Keeping our planet biodiverse can also help slow the effects of climate change. For instance, when forests are cut down at unsustainable levels, we are removing our natural defense against excessive carbon dioxide in our atmosphere.
Updated on by Matthew H. Nash
The saying goes, "dogs are man's best friend." However, is this true internationally? The fact is, animal rights vary drastically around the world. In some countries, dogs are adored like children. In others, they're eaten like chicken. Consequently, we decided to take a deep dive into how canines are treated around the globe. The results of our research are contained within this in-depth Dog-Friendly Country Index to help you learn where the best & worst country for owning or being a dog in 2022.

Stay in the loop with our cutting-edge data analyses
The 51 countries included in our study were selected based on available data. Unfortunately, many countries lack rudimentary information about how they are treating animals, specifically dogs. We used a mixed-methods approach to our research design with the following eight ranking factors to determine scores for each country that are indicative of how well they treat their dogs.
1. Animal protection index (0 to 50 points): This data came from the Animal Protection Index (API) website. The API outlines numerous factors that determine their index, including recognition of animal sentience, the prohibition of animal suffering, and whether or not legislation is in place for animal welfare.
Source: Animal Protection Index
2. Companion animals (0 to 50 points): Data was pulled from the Animal Protection Index. Companion animal scores are based on an A to G ranking determined by legislation aimed at protecting pets and other companion animals within the countries studied.
Source: Animal Protection Index
3. Laws on animal rights (0 to 50 points): This data was obtained via Wikipedia's index and fact-checked by our team on animal rights by country. Points were awarded based on whether the government has animal protection laws or not and if those laws are enforced.
Note: While many countries on our list do have laws on animal rights, we understand that these laws are not consistently enforced. We're under no false assumption that all of these countries are implementing these laws. However, animal rights legislation is a step in the right direction in keeping animals safe from harm.
Source: Wikipedia (Animal rights by country or territory)
4. Laws on animal sentience (0 to 50 points): This metric was obtained through the API. Points were determined by a country having laws that specifically mention animals' capacity to experience sentience.
Source: Animal Protection Index
5. Pet-friendly hotels per capita (0 to 100 points): We identified how many hotels within a certain country allowed dogs to stay on their property and calculated the per capita amount.
Source: Google Hotels
6. Prevalence of rabies (0 to 100 points): Points for this metric were awarded based on a country's status as being "low-risk" for rabies.
Source: Pet Travel
7. Veterinarians per capita (0 to 100 points): We used the website Veterinarian's Guide to collect the number of vets within a country and calculated that against the population to get a vets per capita score.
8. The cultural practice of dog consumption (-100 points): We obtained the data for dog meat consumption from Wikipedia and fact-checked that information using a number of reputable sources. Only countries that still have a widely documented high rate of dog meat consumption were included. These were Switzerland, South Korea, the Philippines, Nigeria, Indonesia, China, and Vietnam.
Source: Wikipedia (Dog meat)
Several metrics would have been good to include, but we were limited due to a lack of data across countries. We found that many countries lack the resources or interest in tracking animal-specific issues, limiting our data collection ability. We decided upon specific metrics directly impacting dog ownership and well-being within our limited data options.

Each of these countries demonstrated a commitment to legislation for protecting animals and a wide variety of factors that can prevent the risk of harm to your faithful companion. These countries scored well on factors such as low instances of rabies, available veterinary clinics and services, as well as pet-friendly accommodations, and they do not have a high prevalence of dog meat consumption.
The top 15 countries for dog ownership are:
Italy, New Zealand, and France rounded out the top three countries for their environment of care for animals. None of these countries have a recorded modern practice of dog consumption. All of them have high rates of veterinary care per capita, and all three countries have exceptional legislation for the protection of animals.

Based on our study, the top 10 worst countries for dog ownership are:
All 15 countries have a high risk for rabies infection (except for South Korea), lack comprehensive legislation for animal welfare, and have very few veterinarians per capita. Additionally, six of these countries have a current, documented practice of eating dog meat. While it may still be possible to have a happy, healthy pet dog within these countries, our findings indicate they are not ideal for the dogs themselves or the owners.

Compiled by World Animal Protection, the Animal Protection Index (API) ranks 50 countries based on ten animal health and welfare factors. Countries receive grades from A to G. While not directly dog-specific, we believe that the factors are related enough to domestic canine health and wellness that we included them as a metric. Interestingly, no country received an “A” grade from the World Animal Protection group.
The countries that ranked the highest are:
The countries that ranked the lowest are:
We gave extra consideration to legislation regarding companion animals and their legal protections within our selected countries. This metric was also from the API and ranked on an A to G scale. This dealt explicitly with laws around a citizen’s failure to act ethically regarding animals under their care and laws prohibiting the abandonment of companion animals.
The countries that ranked the highest for companion animals:
The countries that ranked the lowest for companion animals:
Some countries still do not have any formally recognized legislation around the treatment of animals. This includes laws against animal cruelty, needless animal suffering, and the recognition of animal sentience.
There are only five countries with no documented laws on animal rights:
A country that formally and legally recognizes that animals have sentience (the ability to have emotions like joy, fear, and pain) is more likely to have legislation to protect animals from unnecessary suffering. Still, we found 26 countries with laws on animal rights but no laws on animal sentience.
The only countries that have complete laws on animal sentience:

Pet-friendly hotels are often an indicator of how open and accepting of animals the country is likely to be. It is also a good metric for pet owners to know if their country is likely to have available accommodation if traveling with their dog. When traveling with your dog, it's important to bring appropriate gear.
The countries with the most pet-friendly hotels per million are:
While rabies may no longer pose a significant risk in some parts of the world, it is still a massive problem within many countries. Rabies causes an estimated 59,000 human deaths per year, mainly in Asia and Africa. Owning a dog in a country with significant instances of rabies is inherently risky. You can do your best to keep your dog and yourself safe from infection, but you cannot entirely eliminate the risk in a country where rabies is still rampant.
There are only 16 countries considered completely rabies-free:
Your dog’s ability to be healthy and happy depends largely on their access to quality healthcare. Particularly in an emergency, the proximity to a vet could mean life or death for your pup.
The countries with the most vets per capita are:
The countries with the fewest vets per capita are:
Lastly, and possibly most controversially, we included the metric of the recorded, ongoing dog meat consumption and deducted 100 points from countries where it is still prevalent. We did not give any points to countries that do not practice dog meat consumption.
The countries where dog consumption is most prevalent:
Yeah. We were surprised as well. Though the practice is controversial, it is widely rumored from multiple sources to still take place in Switzerland, especially in rural areas such as Lucerne, Appenzell, Jura, St. Gallen, and in the canton of Bern. Although it is hard to ascertain exactly how common it is, our in-depth review of the topic found that there are countless people who admit to knowing a family member who has eaten dog or cat meat in their lifetime.
Efforts have been made to petition the government for an addendum to the current laws on animal cruelty that already bans the commercial sale of cat and dog meat to include private culling and consumption as well. However, as of this writing in 2022, dog slaughter and consumption are still legal in Switzerland because the petition only gained 16,000 of the required 50,000 signatures to force a referendum on the issue due to Switzerland’s system of direct democracy.
Numerous countries have a long history of dog-eating and consider it part of their culinary tradition. While animal rights activists are pushing for change, some cultures are pushing back against it. In fact, there are entire dog meat festivals in China. While some people in countries like South Korea and Indonesia see dog meat as having health or medicinal properties, countries are starting to become more rigid about the consequences of illegal dog meat distribution. That being said, an estimated 30 million dogs are still slaughtered annually in Asia alone for food and medicinal purposes.
Dog ownership is rewarding, no matter what country you are in. However, being mindful of the environmental issues, available healthcare services, and disease rates in your country will help you better protect your dog. If you are located within the United States, check out our list of the top 150 dog-friendly cities in 2022.
Published on by Matthew H. Nash
There is little doubt our oceans are rising, and cities will go under. It is no longer an issue of if but when. No one can predict exactly when; however, based on simple elevation maps, we can predict which major world cities are most likely to be underwater first.

Stay in the loop with our cutting-edge data analyses
Climate Central created the Coastal Risk Screening Tool, an interactive map that allows users to view maps by risk area. We used the “water level” map to demonstrate the conservative estimate of 1.5 meters (5 ft). Some predictions put sea levels at much higher rates as we go towards the year 2100, even up to 2.5 meters if nothing is done to slow greenhouse emissions.
1.5 meters is a realistic estimate that will most likely occur within the next 80 years. This scenario is possible given current projections, global temperature rise, and inaction by major global political and industry leaders.
We used Euromonitor to identify 36 of the most visited cities in the world that will be affected by sea-level rise. Using the maps generated for these cities, we identified the major tourist attractions at risk of being fully or partially submerged within the identified zones that will be affected by sea-level rise.
We ranked these 36 cities by population in order to highlight the most at-risk destinations that will have the highest displacement of life as we know it. As mentioned, in just these 36 cities, over 226 million will be directly impacted in the coming years.
We can see tourist destinations already struggling under the rising sea levels and the damage caused by frequent flooding. Venice is an easy example of a tourist destination experiencing significant and worsening strain from frequent flooding.
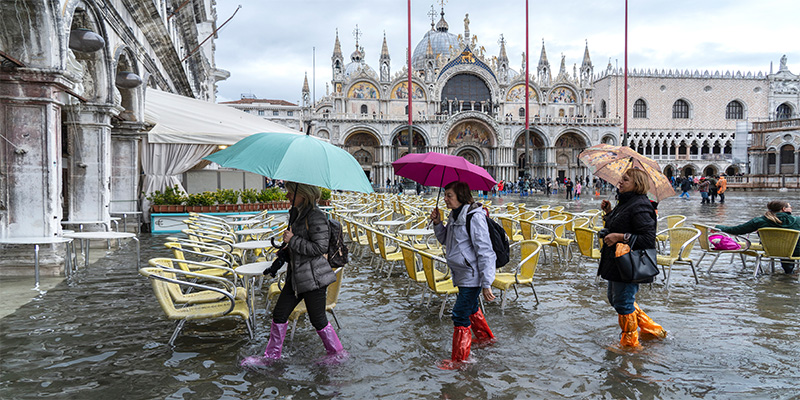
Venice’s St. Mark’s Basilica has already suffered serious flood and water damage. Despite efforts to introduce a flood barrier system, St. Mark’s Square was damaged in 2020 when the flood barrier was not used, demonstrating that even when there are infrastructures in place to prevent the effects of the climate crisis, they are imperfect and will only solve some of the problems.

Popular tourist destination Waikiki Beach in Hawaii is already struggling with rising sea levels and requires further protection against increasing coastal erosion. 13 miles of Hawaiian beach have already disappeared in the last century. Their current attempts at replenishing beaches with imported sand are expensive and temporary measures.
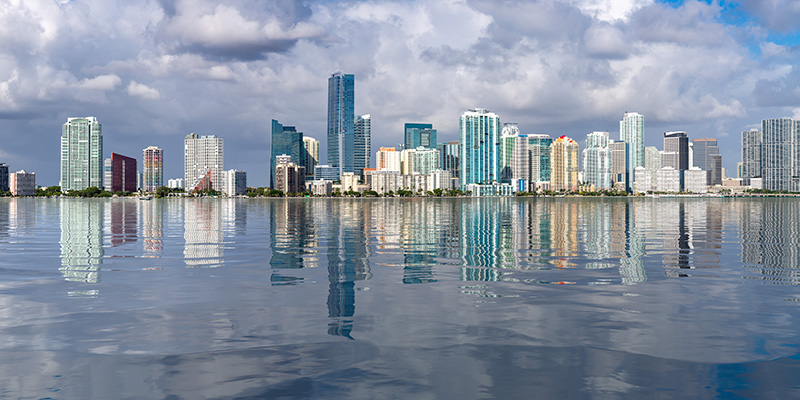
The state of Florida is investing $4 billion dollars in preventing further damage, in particular to Miami Beach, a popular tourist destination with almost 1,200 homes currently at risk of flooding. In fact, flooding is becoming an annual occurrence in this region.

According to UNESCO, the famous Easter Island and its iconic Moai statues are gravely at risk from sea-level rise and rainfall. The island is already undergoing significant erosion, and the rising waves inch closer to the heritage site every year.

Over 90 islands in the Maldives already experience flooding each year, and they are projected to lose 80% or more of their islands in the next three decades. Plans are already being made by the local government to purchase land in other countries as insurance for relocating the Maldivian population if necessary.

This famous European UNESCO Heritage site is visited by millions of people each year. The myriad plant and animal species are at risk from sea-level rise and erosion, which will cause significant damage. Efforts are being made to prevent this from happening.

Although Eifel is not on the coast, overflowing rivers are also subject to major climate change catastrophes. As an example, the Eifel region, which is located in Germany’s epicenter of wineries and wine festivals, was hit with massive flooding in 2021 that leveled buildings and ruined businesses. Over 220 people died in Germany and Belgium during these floods.

Florida’s famous Key West already has invested in massive infrastructure and relocation projects before untold damage is done. Experts are estimating that parts of Key West will be underwater by 2040, and the money it would cost to prepare for this is in the billions.

New York City is experiencing increasing frequency and severity of floods, receiving the city's first flash flood emergency in recorded history in November 2021. This is a problem that New York is structurally not prepared for. Among its most iconic tourist attractions, the Statue of Liberty was massively damaged during Hurricane Sandy and is at further, immediate risk of damage from rising sea levels.

According to the United Nations, approximately 10% of the world's population (or 790 million people) live on the coastline. Many of the world’s biggest cities have evolved along the coasts of the world. Historically, these coastal cities have prospered due to the ease of trade and commerce. These economic hubs are also some of the most populated cities, which puts millions of inhabitants at risk. An estimated two-thirds of cities with over 5 million people are located in threatened coastal regions.
Coastal erosion is a major threat without even factoring in the increased natural disaster impacts like hurricanes or King tides. This means that cities will face major cataclysmic events prior to being fully submerged permanently.
There are numerous heavily populated sinking cities like Mumbai, Shanghai, NYC, and Miami at risk. With a population of 10 million, Jakarta is considered by some to be “the fastest-sinking city in the world” and is projected to be “entirely underwater by 2050”. In December, 2021, Jakarta was again submerged, with parts of the capital 2.7m (9 ft) underwater.
While some cities are proactively working on coastal management, others are struggling to commit to a plan, like Bangkok. The Thai government has failed to implement any action towards preventing massive issues related to their precarious situation and is receiving criticism from climate scientists. Some predictions put Bangkok underwater by 2050.

Sea level rise is a major issue of concern, but adding to this is the increase of natural disasters that accompany a global rise in temperature. Droughts, wildfires, hurricanes, and tropical storms are expected to increase not only in frequency but also in intensity.
Animals are also being impacted by increasing global temperatures as natural living places are disrupted or no longer inhabitable, which significantly affects biodiversity and their ability to survive in their natural habitats. The extinction of animal species is actually further harming plant seed dispersal, which in turn harms natural climate adaptation.

The impact of rising sea levels will vary depending largely on the ability of local governments to recognize the problem early enough and have the resources to mitigate severe damage. For example, Jakarta is in the process of constructing a $40 billion sea wall to stem the tide. Additionally, the government has passed a law allowing for the capital to be moved from Jakarta to an undeveloped jungle tract on the neighboring island of Borneo.
The United States Geological Survey is currently working on a coastal landscape risk assessment survey of the northeastern region of the United States to (eventually) make recommendations about how to address the climate crisis.
In the possible solution section lower in our article, we share some information about the successful projects the Netherlands has been conducting for decades.
Some city, state, and country responses to sea-level rise:
Like the island nation of Kiribati, some nations literally have nowhere to go and are already preparing their people for mass migration. There isn’t enough money or land for alternative options, and the government is buying property in other countries to move its people to when the inevitable happens. Tuvalu is vanishing within the next couple of decades.
But even the most proactive countries cannot completely prevent the effects of sea-level rise on their populations. Preventative measures will not unilaterally avoid the devastating effects of a global rise in sea temperature, especially when some politicians are still hesitant to even call extreme weather changes “climate change”. In fact, trillions of dollars have already been spent in response to natural disaster events, and this will only increase as the calamities grow in frequency and severity.

Even as we discuss the erosion of coastlines, the destruction of cities, the loss of life, and the untold financial strain of the climate crisis, it can still be very hard for many to conceptualize exactly how serious the problem is. Our infographic aims to show the effects in maps based on credible data, not just in numbers and figures.
Here are some examples of famous attractions that will be either submerged completely or irreparably damaged by the rising sea level:

According to NASA, NOAA, and other science advocacy groups, it’s not too late to slow or prevent much of the devastating effects of climate change.
In the meantime, we can learn a lot from how the Dutch have been handling this problem for decades. The Dutch Delta Works is one of the seven wonders of the modern world and has been keeping the Netherlands above sea level with its network of dams, dikes, levees, and other flood prevention systems beginning in the 1950s.
Check out these resources regarding what we can do as civilians, and how we can lobby politicians to address the climate crisis and prioritize coastal management programs:
The Swiftest is a comparison website to help you find the best insurance product for all areas of life. We believe insurance is a great tool to help mitigate the risks associated with our planet's accelerating uncertainties, including climate change and rising sea levels, so you can avoid huge financial losses. Our current area of focus is auto, pet, travel, life, and renters insurance.
Published on by Matthew H. Nash
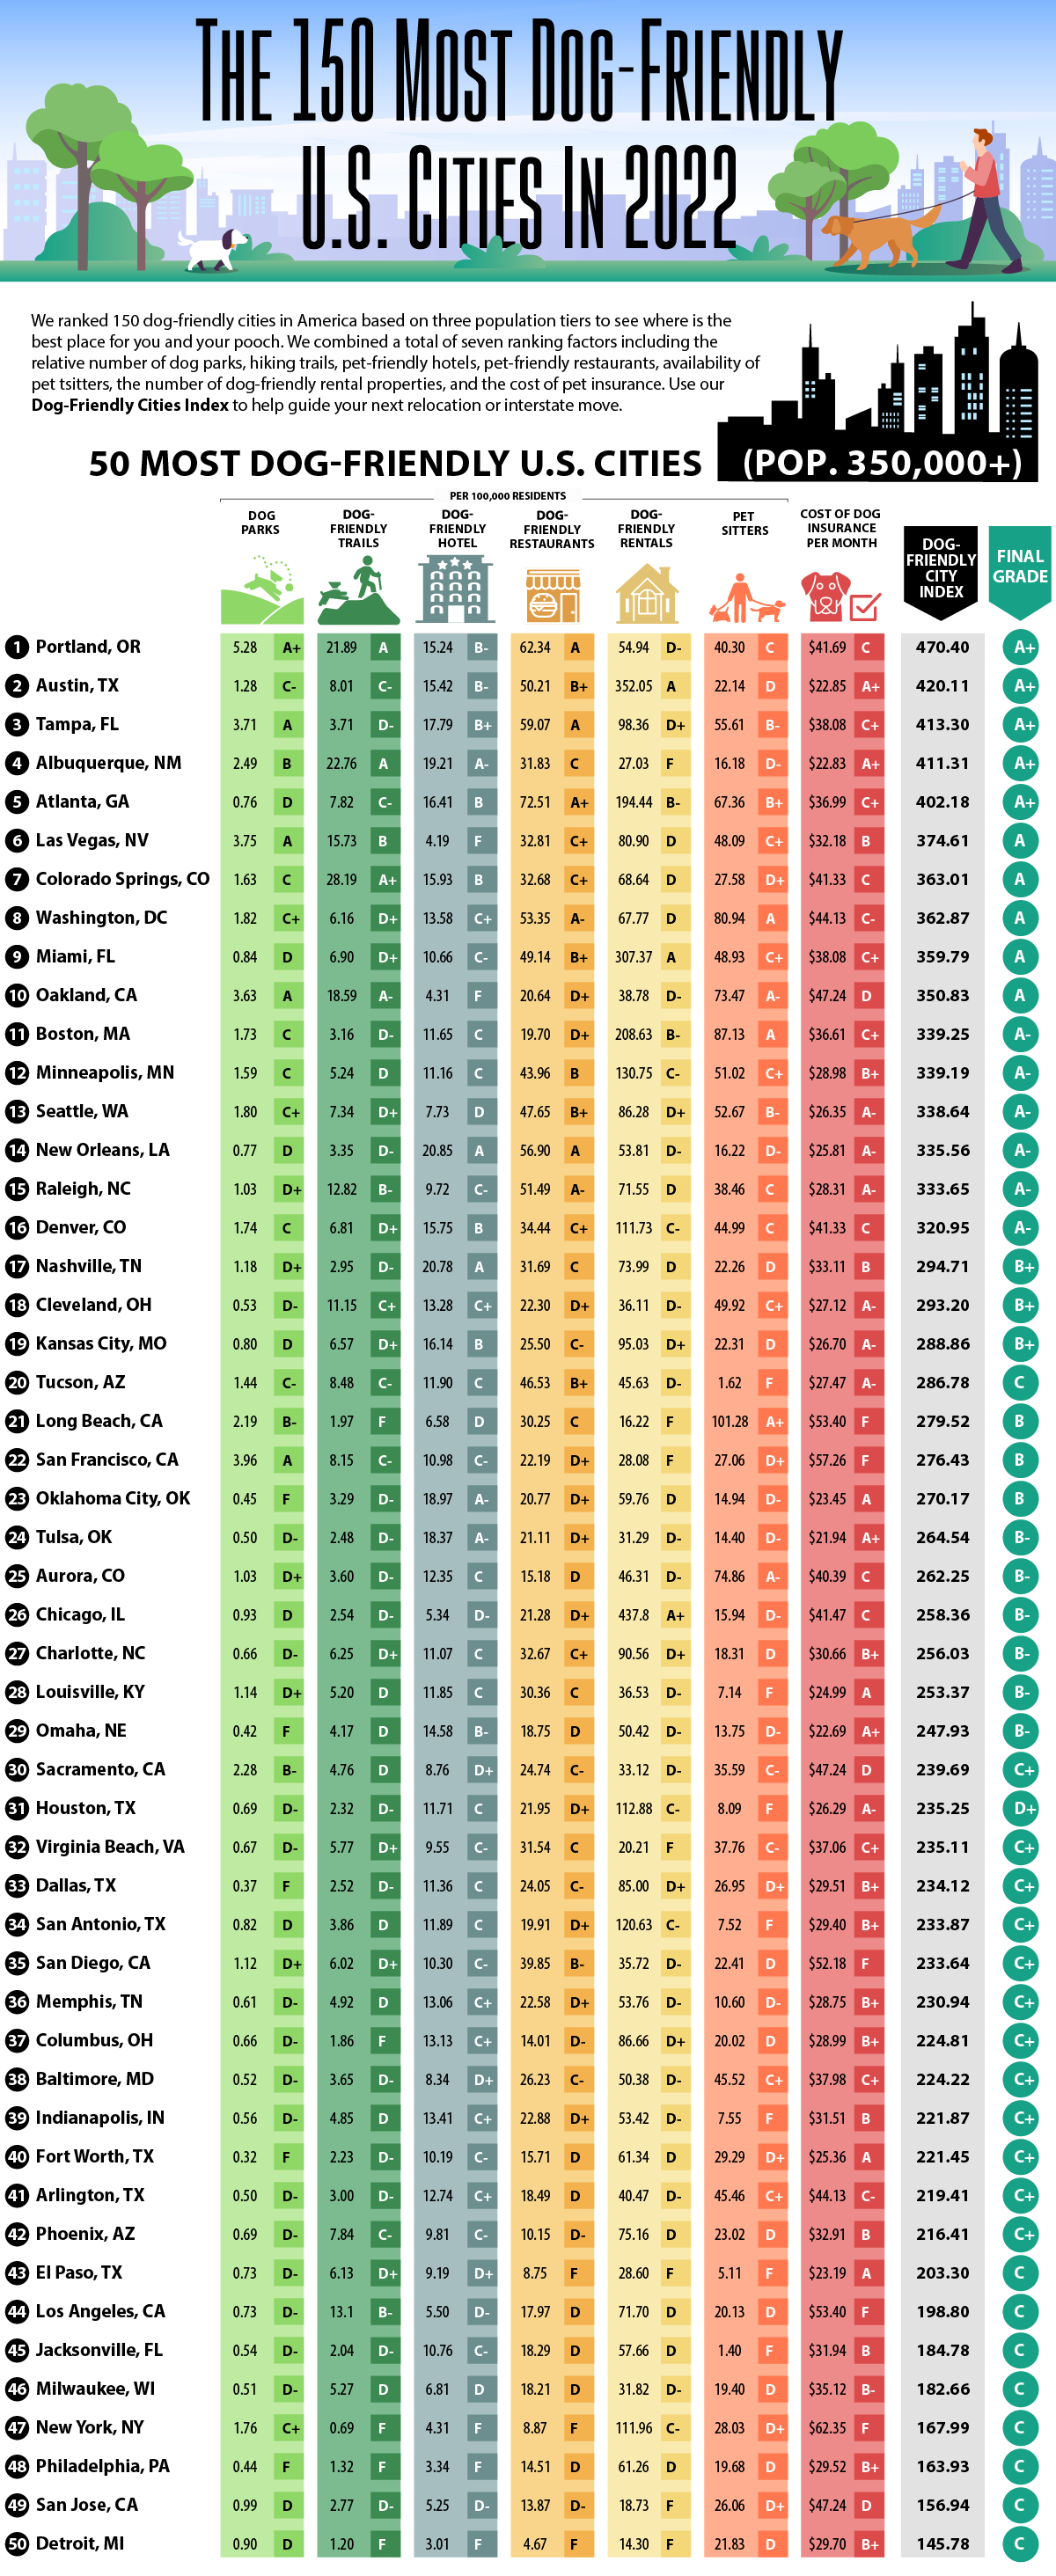
Owning a dog comes with many rewards and challenges. Deciding which city is ideal for you and your pup can be tricky since it depends on so many factors. We’ve created the comprehensive Dog-Friendly Cities Index to help you determine which U.S. city is best for owning a happy and healthy canine.
Stay in the loop with our cutting-edge data analyses
A lot goes into being a good dog owner. Making sure your puppy is well-exercised, safe, socialized, and adequately taken care of can make a significant difference in the quality of life for you and your pet.
To conduct this study, we first determined the cities to be included based on the availability of data for the top 50 cities in all three size brackets:
It’s important to capture a range of city sizes because ranking a smaller city (like Waco, TX) to a bigger city (for example, Chicago, IL) is like comparing apples to oranges. Each tier of city size will have vastly different access to amenities, exercise options, and costs (discussed below).
We ranked the 150 most dog-friendly cities in the U.S. by combining the following 7 factors:
Dog parks (0 to 100 points): We obtained the dog park data from the Trust for Public Land website. We used their ParkServe search feature to get data from the 150 cities we reviewed and arrived at their index score by calculating the number of dog parks per capita.
Source: ParkServe
Dog-friendly trails (0 to 100 points): Trail information was found from the hiking and trails website AllTrails. We specifically searched for the city and put the filter for "dog-friendly trails" to get the data for this metric.
Source: AllTrails
Dog-friendly hotels (0 to 100 points): We used Google Travel to find available dog-friendly hotels within each city and calculated the score per the city's population size.
Source: Google Travel
Dog-friendly restaurants (0 to 100 points): The BringFido.com directory helped us find dog-friendly restaurants within each city, and then we calculated them per capita.
Source: BringFido.com
Dog-friendly rentals (0 to 100 points): We obtained rental data using Realtor.com to find the most current information regarding homes and apartments available to rent that allow dogs within each city. We calculated the data per capita (100,000 residents).
Source: Realtor.com
Pet sitters (0 to 100 points): We used the Sittercity directory to determine the number of dog sitters per capita available within each city.
Source: Sittercity
Cost of dog insurance (0 to 100 points): We collected the dog insurance rates data by searching the website, Figo. We standardized the data by creating a composite pup with a consistent insurance rate (male, two years old, 90% reimbursement, $500 deductible with $5,000 in benefits).
Source: Figo

Based on our study, the top 10 cities (in each size bracket) for dog ownership are:
Large (pop. 350,000+)
Medium (pop. 200,000-350,000)
Small (pop. 140,000-200,000)

These cities are the best in each state for owning a dog. They demonstrated an exceptional commitment to allowing dogs access to public lands, ease of renting apartments and hotels for dog owners, cost of insurance, and more. Keeping your dog healthy requires regular exercise, consistent vet visits, the right kind of puppy essentials, and a safe home for your pup to thrive.
States with no cities that ranked in our study:
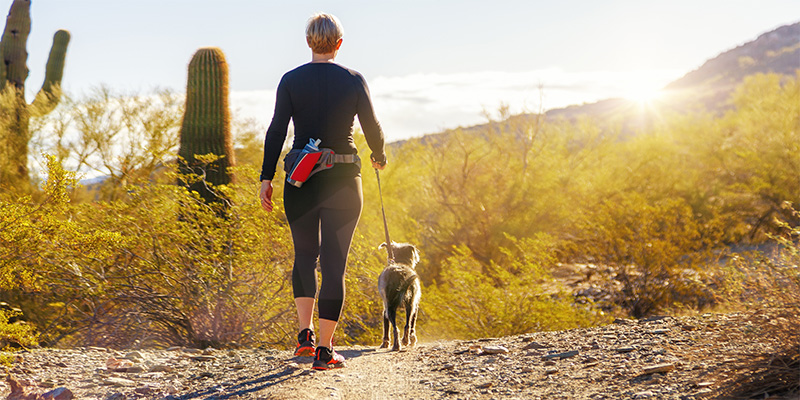
Access to dog-friendly parks is one of the best ways for dogs to socialize and exercise, which is critical for their well-being. Alexandria, Virginia, blew the competition out of the water with almost double the amount of dog parks per capita compared to the next best city, Boise, Idaho.
Number of dog parks per 100,000 residents:
Boise is leading the pack with the most dog-friendly trails per 100,000 residents. AllTrails lists 9,778 dog-friendly trails in the United States, with 105 trails in Boise alone. Access to safe, fun outdoor spaces is great for your dog's physical and mental health.
Number of dog-friendly trails per 100,000 residents:
Pet-friendly hotels indicate an overall culture of dog accessibility within a community. Plus, it's great for tourists who plan to travel with their pets. Metairie, LA came in first with a total of 97 pet-friendly hotel options, which is quite high for a population of only 142,000.
Number of pet-friendly hotels per 100,000 residents:
Like pet-friendly hotels, restaurants that allow canines generally speak to a community of inclusion for companion animals and non-service pets. The ability for dogs to attend local spaces means less time left home alone as well as increased socialization and recreation. Orlando, Florida is an outlier with a whopping 379 pet-friendly restaurants.
Number of pet-friendly restaurants per 100,000 residents:
The inability to find rental properties that allow pets can be a significant stressor for many dog owners or prospective dog owners. This is less of an issue in Chicago, however, as they have an impressive 437.80 dog-friendly apartment rentals per 100,000 residents. Residents of the Windy City should have few problems finding a great apartment for their pets.
Number of dog-friendly rentals per 100,000 residents:
It can be challenging to leave the city or state if you don't have a reliable pet sitter. Knowing there is a range of high-quality, professional, and reliable pet sitting options eases the burden for pet owners. Jersey City, NJ and Yonkers, NY have the highest rates of pet sitters, likely because of the densely packed tri-state area.
Number of pet sitter rentals per 100,000 residents:
Of the various costs associated with dog ownership, pet insurance can vary significantly depending on where you live. Knowing you will likely need to factor in this expense for the duration of your dog's life will help with budgeting, but it will also keep expenses reasonable if a major health concern or an emergency comes up. Tulsa, Oklahoma has the lowest rates of pet insurance on our list, but many Texas cities also made it to the top 10.

It makes sense that the cost of pet insurance would vary by breed and age. But why is there such a range of prices between American cities? A healthy, 2-year-old Golden Retriever insured in Albuquerque, New Mexico, would cost roughly $22.83/mo, while a similar dog in New York City would cost approximately $62.35/mo.
The primary reason for the cost of pet insurance differing between cities is due to varying veterinary expenses and the overall cost of living in a city. As the cost of living goes up, so does the cost of renting or leasing the veterinary clinic building, employing the veterinary staff, the cost of supplies, and other related expenses. It is logical, but it dramatically increases the expense of owning a dog in many larger U.S. cities, and prospective owners will need to factor in the added costs over the pet's lifespan.

Published on by Matthew H. Nash
Owning a dog comes with many rewards and challenges. Deciding which city is ideal for you and your pup can be tricky since it depends on so many factors. We’ve created the comprehensive Dog-Friendly Cities Index to help you determine which U.S. city is best for owning a happy and healthy canine.
Stay in the loop with our cutting-edge data analyses
A lot goes into being a good dog owner. Making sure your puppy is well-exercised, safe, socialized, and adequately taken care of can make a significant difference in the quality of life for you and your pet.
To conduct this study, we first determined the cities to be included based on the availability of data for the top 50 cities in all three size brackets:
It’s important to capture a range of city sizes because ranking a smaller city (like Waco, TX) to a bigger city (for example, Chicago, IL) is like comparing apples to oranges. Each tier of city size will have vastly different access to amenities, exercise options, and costs (discussed below).
We ranked the 150 most dog-friendly cities in the U.S. by combining the following 7 factors:
Dog parks (0 to 100 points): We obtained the dog park data from the Trust for Public Land website. We used their ParkServe search feature to get data from the 150 cities we reviewed and arrived at their index score by calculating the number of dog parks per capita.
Source: ParkServe
Dog-friendly trails (0 to 100 points): Trail information was found from the hiking and trails website AllTrails. We specifically searched for the city and put the filter for "dog-friendly trails" to get the data for this metric.
Source: AllTrails
Dog-friendly hotels (0 to 100 points): We used Google Travel to find available dog-friendly hotels within each city and calculated the score per the city's population size.
Source: Google Travel
Dog-friendly restaurants (0 to 100 points): The BringFido.com directory helped us find dog-friendly restaurants within each city, and then we calculated them per capita.
Source: BringFido.com
Dog-friendly rentals (0 to 100 points): We obtained rental data using Realtor.com to find the most current information regarding homes and apartments available to rent that allow dogs within each city. We calculated the data per capita (100,000 residents).
Source: Realtor.com
Pet sitters (0 to 100 points): We used the Sittercity directory to determine the number of dog sitters per capita available within each city.
Source: Sittercity
Cost of dog insurance (0 to 100 points): We collected the dog insurance rates data by searching the website, Figo. We standardized the data by creating a composite pup with a consistent insurance rate (male, two years old, 90% reimbursement, $500 deductible with $5,000 in benefits).
Source: Figo
Based on our study, the top 10 cities (in each size bracket) for dog ownership are:
Large (pop. 350,000+)
Medium (pop. 200,000-350,000)
Small (pop. 140,000-200,000)
These cities are the best in each state for owning a dog. They demonstrated an exceptional commitment to allowing dogs access to public lands, ease of renting apartments and hotels for dog owners, cost of insurance, and more. Keeping your dog healthy requires regular exercise, consistent vet visits, the right kind of puppy essentials, and a safe home for your pup to thrive.
States with no cities that ranked in our study:
Access to dog-friendly parks is one of the best ways for dogs to socialize and exercise, which is critical for their well-being. Alexandria, Virginia, blew the competition out of the water with almost double the amount of dog parks per capita compared to the next best city, Boise, Idaho.
Number of dog parks per 100,000 residents:
Boise is leading the pack with the most dog-friendly trails per 100,000 residents. AllTrails lists 9,778 dog-friendly trails in the United States, with 105 trails in Boise alone. Access to safe, fun outdoor spaces is great for your dog's physical and mental health.
Number of dog-friendly trails per 100,000 residents:
Pet-friendly hotels indicate an overall culture of dog accessibility within a community. Plus, it's great for tourists who plan to travel with their pets. Metairie, LA came in first with a total of 97 pet-friendly hotel options, which is quite high for a population of only 142,000.
Number of pet-friendly hotels per 100,000 residents:
Like pet-friendly hotels, restaurants that allow canines generally speak to a community of inclusion for companion animals and non-service pets. The ability for dogs to attend local spaces means less time left home alone as well as increased socialization and recreation. Orlando, Florida is an outlier with a whopping 379 pet-friendly restaurants.
Number of pet-friendly restaurants per 100,000 residents:
The inability to find rental properties that allow pets can be a significant stressor for many dog owners or prospective dog owners. This is less of an issue in Chicago, however, as they have an impressive 437.80 dog-friendly apartment rentals per 100,000 residents. Residents of the Windy City should have few problems finding a great apartment for their pets.
Number of dog-friendly rentals per 100,000 residents:
It can be challenging to leave the city or state if you don't have a reliable pet sitter. Knowing there is a range of high-quality, professional, and reliable pet sitting options eases the burden for pet owners. Jersey City, NJ and Yonkers, NY have the highest rates of pet sitters, likely because of the densely packed tri-state area.
Number of pet sitter rentals per 100,000 residents:
Of the various costs associated with dog ownership, pet insurance can vary significantly depending on where you live. Knowing you will likely need to factor in this expense for the duration of your dog's life will help with budgeting, but it will also keep expenses reasonable if a major health concern or an emergency comes up. Tulsa, Oklahoma has the lowest rates of pet insurance on our list, but many Texas cities also made it to the top 10.
It makes sense that the cost of pet insurance would vary by breed and age. But why is there such a range of prices between American cities? A healthy, 2-year-old Golden Retriever insured in Albuquerque, New Mexico, would cost roughly $22.83/mo, while a similar dog in New York City would cost approximately $62.35/mo.
The primary reason for the cost of pet insurance differing between cities is due to varying veterinary expenses and the overall cost of living in a city. As the cost of living goes up, so does the cost of renting or leasing the veterinary clinic building, employing the veterinary staff, the cost of supplies, and other related expenses. It is logical, but it dramatically increases the expense of owning a dog in many larger U.S. cities, and prospective owners will need to factor in the added costs over the pet's lifespan.
Updated on by Matthew H. Nash
Animal rights laws vary greatly around the world. Animal rights activists argue that animals are sentient beings that deserve a life free from suffering. From recognition of animal sentience to fur-farming bans, many countries are taking a stand against animal cruelty in any way they can. There are also other considerations that can impact animal health and welfare, such as pesticide use and meat consumption.
We gathered statistics from key international data sources in order to create this comprehensive "Animal Rights Index," which helps identify which countries are the best and worst in terms of animal rights.

Stay in the loop with our cutting-edge data analyses

Based on our research on animal rights data in 65 different countries, these are the twenty countries with the best animal rights laws and regulations along with their animal welfare rating scores:
These European countries scored highly mainly because they all have animal cruelty laws as well as regulations recognizing that animals are sentient and can suffer pain. They also have full fur-farming bans or partial bans on farming certain animals for fur.

The following are the twenty countries with the worst animal welfare regulations and their animal welfare scores:
These countries have very few, if any, animal cruelty laws on the books. Most do not recognize that animals feel pain or are sentient beings. They also have smaller percentages of protected areas set aside for wildlife and often have high rates of meat consumption.
Surprisingly, the United States ranks 39th on the list. While the country does have a history of strong animal rights and anti-cruelty laws, excessive meat consumption, lack of fur-farming restrictions, relatively low protected areas and the fact that animal sentience is not recognized at the federal level push it down the list. Many Americans own pets and consider them a part of their families, but they often don’t make the connection between household pets and animals used for food, resources, and the general wildlife. Humanitarians maintain that all animals deserve the same considerations for their well-being, whether they are pets, livestock, or wild animals.

What are animal rights? Essentially, this is the belief that all animals should be granted the same basic level of compassion as human beings. The assumption is that animals are not merely possessions — they are living, breathing creatures that can feel pain. Recognizing this is one of the most basic tenets of animal rights. The more we learn about how animals think and feel pain, the more we can work on protecting them and treating them humanely.
Some groups of people involved in the animal rights movement, like vegans, go even further by denouncing all animal by-products, including leather and dairy. They argue that even if animals are given first-class treatment all of their lives and killed humanely, they shouldn’t have their lives ended by humans. These individuals are generally against these practices:
Please note: You can scroll horizontally to see all the data. The titles of each column allow you to sort the data based on that one metric.
| Country | Recognition of Animal Sentience | Recognition of Animal Suffering | Any Laws Against Animal Cruelty | Support for the Universal Declaration of Animal Welfare | Fur-Farming Ban | Meat Consumption per Capita in Kilograms | Percentage of Protected Areas | Kgs of Pesticide / Hectare of Cropland | Environmental Performance Index Score | Total Score |
|---|---|---|---|---|---|---|---|---|---|---|
| Luxembourg | Yes | Yes | Yes | Partial | Yes | 80.07 | 40.87 | 2.8 | 82.3 | 519.68 |
| United Kingdom | Yes | Yes | Yes | Partial | Yes | 79.89 | 28.68 | 3.2 | 81.3 | 506.36 |
| Austria | Yes | Yes | Yes | Partial | Yes | 87.22 | 28.4 | 3.3 | 79.6 | 501.73 |
| Czechia | Yes | Yes | Yes | Partial | Yes | 82.78 | 22.16 | 1.7 | 71 | 498.66 |
| Belgium | Yes | Yes | Yes | Partial | Yes | 65.77 | 23.29 | 6.7 | 73.3 | 488.86 |
| Croatia | Yes | Yes | Yes | No | Yes | 75.29 | 38.25 | 1.8 | 63.1 | 486.36 |
| Sweden | Yes | Yes | Yes | Yes | Partial | 77.06 | 14.88 | 0.6 | 78.7 | 478.10 |
| Netherlands | Yes | Yes | Yes | Partial | Yes | 75.81 | 11.24 | 7.9 | 75.3 | 470.32 |
| Bulgaria | Yes | Yes | Yes | Partial | Partial | 58.31 | 34.7 | 0.9 | 57 | 464.66 |
| Switzerland | Yes | Yes | Yes | Yes | Partial | 67.53 | 9.67 | 4.7 | 81.5 | 463.18 |
| Greece | Yes | Yes | Yes | Partial | Partial | 71.69 | 35.22 | 2.9 | 69.1 | 459.45 |
| Denmark | Yes | Yes | Yes | Partial | Partial | 70.82 | 18.1 | 1.1 | 82.5 | 458.98 |
| Germany | Yes | Yes | Yes | Partial | Partial | 87.78 | 37.75 | 4 | 77.2 | 456.02 |
| Poland | Yes | Yes | Yes | Partial | Partial | 88.7 | 39.65 | 2.2 | 60.9 | 454.39 |
| Estonia | Yes | Yes | Yes | Partial | Partial | 63.63 | 20.22 | 1 | 65.3 | 453.80 |
| Finland | Yes | Yes | Yes | Partial | Partial | 76.69 | 15.02 | 0.6 | 78.9 | 453.50 |
| New Zealand | Yes | Yes | Yes | Yes | Partial | 100.89 | 32.55 | 7.9 | 71.3 | 452.47 |
| France | Yes | Yes | Yes | Partial | Partial | 83.04 | 25.79 | 3.6 | 80 | 450.11 |
| Ireland | Yes | Yes | Yes | Partial | Partial | 19.06 | 14.44 | 6.5 | 72.8 | 449.97 |
| Latvia | Yes | Yes | Yes | Partial | Partial | 68.72 | 18.17 | 1.1 | 61.6 | 447.23 |
| Hungary | Yes | Yes | Yes | Partial | Partial | 79.72 | 22.6 | 2.2 | 63.7 | 443.96 |
| Spain | Yes | Yes | Yes | Partial | Partial | 100.25 | 28.07 | 3.6 | 74.3 | 441.82 |
| Lithuania | Yes | Yes | Yes | Partial | Partial | 81.27 | 17.02 | 1.4 | 62.9 | 440.75 |
| Norway | Partial | Yes | Yes | No | Yes | 67.46 | 17.11 | 0.8 | 77.7 | 432.66 |
| Italy | Yes | Yes | Yes | Partial | Partial | 80.95 | 21.54 | 6.1 | 71 | 432.03 |
| Portugal | Yes | Yes | Yes | Partial | Partial | 94.06 | 22.9 | 5.4 | 67 | 428.25 |
| Cyprus | Yes | Yes | Yes | Partial | Partial | 72.82 | 18.65 | 8.2 | 64.8 | 420.86 |
| Malta | Yes | Yes | Yes | Partial | Partial | 82.05 | 30.29 | 12 | 70.7 | 416.96 |
| Romania | Yes | Yes | Yes | Partial | Partial | 63.91 | 24.46 | 0.8 | 64.7 | 408.00 |
| Tanzania | Partial | Yes | Yes | Yes | No | 9.22 | 38.15 | 0.00006 | 31.1 | 400.37 |
| Chile | Yes | Yes | Yes | Yes | No | 83.16 | 18.49 | 5.7 | 55.3 | 395.33 |
| Brazil | Yes | Yes | Yes | Yes | No | 99.83 | 29.42 | 6 | 51.2 | 395.08 |
| Mexico | Partial | Yes | Yes | No | Partial | 64.87 | 14.5 | 1.8 | 52.6 | 362.26 |
| Canada | Partial | Yes | Yes | Yes | No | 82.62 | 9.69 | 2.4 | 71 | 359.53 |
| Japan | No | Yes | Yes | No | Yes | 49.33 | 29.39 | 11.8 | 75.1 | 357.74 |
| Indonesia | Partial | Yes | Yes | Partial | No | 11.7 | 12.17 | 0.03113 | 37.8 | 354.32 |
| India | No | Yes | Yes | Partial | Partial | 3.78 | 5.97 | 0.3 | 27.6 | 344.57 |
| Peru | No | Yes | Yes | Yes | No | 24.41 | 21.31 | 1.8 | 44 | 329.64 |
| Israel | No | Yes | Yes | No | Yes | 97.01 | 19.95 | 12.6 | 65.8 | 321.13 |
| United States | Partial | Yes | Yes | Partial | No | 124.1 | 12.99 | 2.5 | 69.3 | 319.45 |
| Venezuela | No | Yes | Yes | No | No | 40.94 | 54.14 | 1.2 | 50.3 | 309.41 |
| Australia | Partial | Yes | Yes | No | No | 121.6 | 19.27 | 2 | 74.9 | 306.56 |
| Thailand | No | Yes | Yes | Partial | No | 27.37 | 18.81 | 1.7 | 45.4 | 302.37 |
| Turkey | Partial | Yes | Yes | No | No | 38.87 | 0.22 | 2.3 | 42.6 | 301.58 |
| Zambia | No | Yes | Yes | No | No | 13.12 | 37.87 | 0.1 | 34.7 | 300.34 |
| Malaysia | No | Yes | Yes | Yes | No | 52.89 | 19.12 | 8.1 | 47.9 | 294.46 |
| Zimbabwe | No | Yes | Yes | No | No | 17.67 | 27.21 | 0.5 | 37 | 288.53 |
| Kenya | No | Yes | Yes | No | No | 15.94 | 12.36 | 0.2 | 34.7 | 275.26 |
| Ukraine | No | Yes | Yes | No | No | 46.92 | 3.99 | 2.3 | 49.5 | 256.00 |
| Saudi Arabia | No | Yes | Yes | No | No | 54.12 | 4.76 | 1.5 | 44 | 253.53 |
| South Africa | Partial | Partial | Yes | No | No | 60.02 | 8 | 2.2 | 43.1 | 250.93 |
| Myanmar | No | Yes | Yes | No | No | 58.24 | 6.37 | 1.4 | 25.1 | 242.29 |
| Uruguay | No | Yes | Yes | No | No | 57.69 | 3.45 | 5.4 | 49.1 | 239.09 |
| Colombia | No | Yes | Yes | No | No | 55.9 | 14.81 | 9.9 | 52.9 | 235.43 |
| Morocco | No | Yes | Partial | No | No | 35.12 | 30.78 | 1.5 | 42.3 | 234.19 |
| Niger | No | Partial | Yes | No | No | 12.75 | 17.32 | 0.0012 | 30.8 | 229.52 |
| Argentina | No | Yes | Yes | No | No | 109.38 | 8.81 | 4.9 | 52.2 | 227.00 |
| Egypt | No | Yes | Partial | No | No | 26.29 | 13.14 | 2.2 | 43.3 | 219.39 |
| Russia | No | No | Yes | No | Partial | 76.61 | 9.73 | 0.2 | 50.5 | 207.96 |
| Ethiopia | No | No | Yes | No | No | 27.6 | 18.47 | 0.2 | 34.4 | 176.02 |
| Mali | No | No | Yes | No | No | 23.68 | 8.23 | 0.00057 | 29.4 | 165.88 |
| Algeria | No | No | Partial | No | No | 18.06 | 7.5 | 0.7 | 44.8 | 124.13 |
| Belarus | No | No | No | No | Partial | 81.46 | 9.35 | 0.6 | 53 | 105.65 |
| Azerbaijan | No | No | No | No | No | 34.08 | 10.16 | 0.2 | 46.5 | 73.07 |
| Iran | No | No | No | No | No | 35.98 | 8.61 | 0.3 | 48 | 71.40 |
| Vietnam | No | No | No | No | No | 63.33 | 7.58 | 1.7 | 33.4 | 45.24 |
| China | No | No | No | No | No | 60.59 | 15.45 | 13.1 | 37.3 | 12.46 |
There are many groups around the world that advocate on behalf of animal rights and welfare.
The following are animal welfare organizations that aim to secure the rights of animals:
At The Swiftest, we believe that animals are sentient beings and deserve the right to live a happy and healthy life free from abuse or unnecessary suffering. I am personally a lifelong pet owner, from dogs, cats, fish, parrots, you name it, and I probably had it. Around 1,000 dogs and cats are euthanized in the USA every day, and many of these euthanizations could have been prevented if the owner simply had pet insurance. If you get the right policy for your animal, everything from sudden and catastrophic to even wellness treatments can be covered, improving the length and quality of your furry friend's life. If you're getting a new dog or adopting an older dog, see our helpful new puppy checklist.
The Swiftest is a free insurance comparison service currently focused on auto, pet, travel, life, and renters insurance. We have spent months researching the best dog insurance policies in each U.S. state. You can learn more about your state by clicking on the links below.
Published on by Matthew H. Nash – Licensed Insurance Agent

Millions of dog bites occur every year in the United States and worldwide. A dog bite can range from a quick pinch to a severe injury requiring medical attention to even death in some instances. Thankfully, dog-bite-related fatalities are rare.
We analyzed various studies and data to create a collection of dog bite statistics that covers a wide variety of topics related to dog bites. It includes an overview of the dog breeds that are most likely to bite or to cause a fatality, the most common demographics of dog bite victims, what dog has the strongest bite, how dog bite liability has grown over time, and tips on how to stop a dog from biting you to begin with.
There is no global tracking of dog bite incidents, but it is estimated that tens of millions of injuries from dog attacks occur each year around the world. Dog bites are the source of most animal bite injuries, with studies revealing that they account for 76-94% of such injuries. Dog bites also make up more than 50% of all animal-related injuries to people who are traveling.
Not all dog bites are severe enough to warrant medical attention, but some can lead to severe injury. Below are some general dog bite statistics for the United States that have been discovered through various studies. Other high-income countries, like Australia, Canada, and France, were found to have similar incidence and fatality rates.
When we think of the type of dogs that bite, we usually think of bigger, more muscular dogs like pit bulls or rottweilers, but which dog breeds are actually the most likely to bite? Using data from a study on breed differences in canine aggression, we ranked dog breeds on how likely they are to be aggressive toward strangers, their owners, or other dogs. The rankings are based on the percentage of dogs of each breed in the study that received a maximum score of 4 for aggression due to snaps, bites, or attempts to bite the subject.
How do pit bulls rank against other dog breeds when it comes to showing aggression to strangers, owners, and other dogs? Check out these dog bite statistics by breed to see how they compare to other types of dogs.
Smaller dog breeds, like the dachshund and chihuahua, were found to show the most aggression toward strangers through snaps, bites, or attempts to bite. One-fifth of all of the dachshunds in the study received the maximum score for aggression, the most of any dog breed.
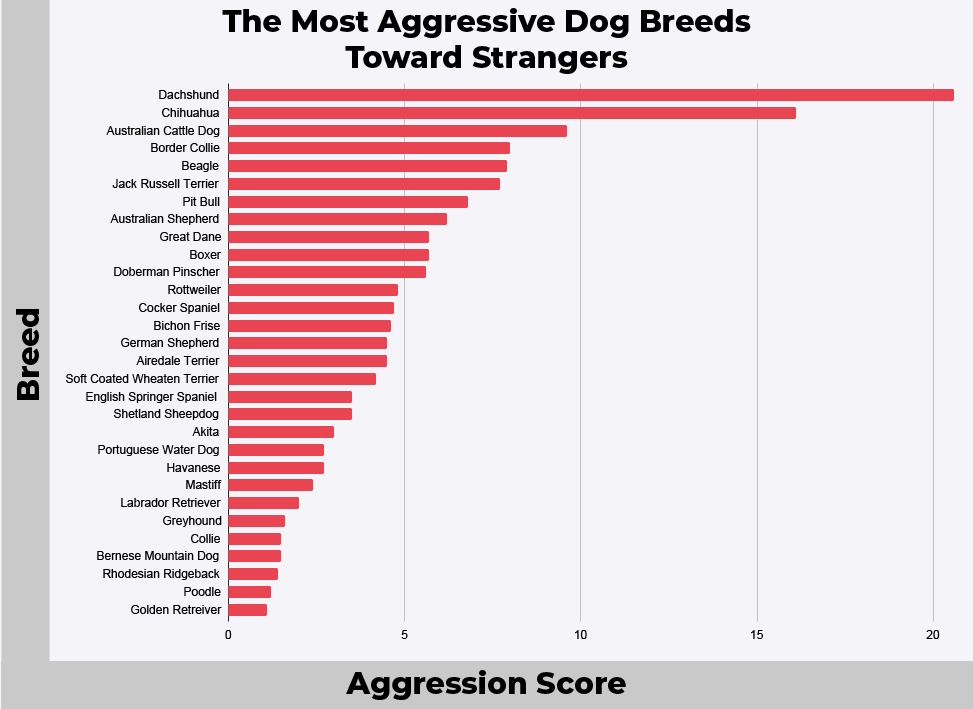
| Breed | Aggression Score |
|---|---|
| Dachshund | 20.6 |
| Chihuahua | 16.1 |
| Australian Cattle Dog | 9.6 |
| Border Collie | 8 |
| Beagle | 7.9 |
| Jack Russell Terrier | 7.7 |
| Pit Bull | 6.8 |
| Australian Shepherd | 6.2 |
| Boxer | 5.7 |
| Great Dane | 5.7 |
| Doberman Pinscher | 5.6 |
| Rottweiler | 4.8 |
| Cocker Spaniel | 4.7 |
| Bichon Frise | 4.6 |
| German Shepherd | 4.5 |
| Airedale Terrier | 4.5 |
| Soft Coated Wheaten Terrier | 4.2 |
| English Springer Spaniel | 3.5 |
| Shetland Sheepdog | 3.5 |
| Akita | 3 |
| Portuguese Water Dog | 2.7 |
| Havanese | 2.7 |
| Mastiff | 2.4 |
| Labrador Retriever | 2 |
| Greyhound | 1.6 |
| Collie | 1.5 |
| Bernese Mountain Dog | 1.5 |
| Rhodesian Ridgeback | 1.4 |
| Poodle | 1.2 |
| Golden Retreiver | 1.1 |
| Siberian Husky | 0 |
| Brittany Spaniel | 0 |
| Whippet | 0 |
Once again, smaller dog breeds were found to be the most aggressive, but this time against their owner. The beagle came out on top, with 7.9% of beagles in the study earning the highest aggression score. Dachshunds aren’t only aggressive toward strangers; they were also found to be the second most aggressive dog breed toward their owners.
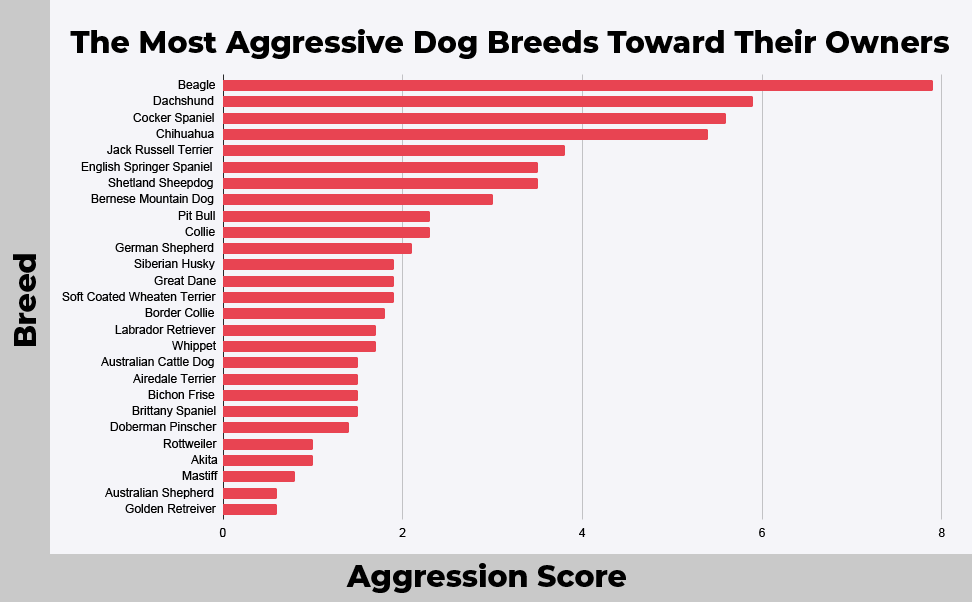
| Breed | Aggression score |
|---|---|
| Beagle | 7.9 |
| Dachshund | 5.9 |
| Cocker Spaniel | 5.6 |
| Chihuahua | 5.4 |
| Jack Russell Terrier | 3.8 |
| English Springer Spaniel | 3.5 |
| Shetland Sheepdog | 3.5 |
| Bernese Mountain Dog | 3 |
| Pit Bull | 2.3 |
| Collie | 2.3 |
| German Shepherd | 2.1 |
| Soft Coated Wheaten Terrier | 1.9 |
| Great Dane | 1.9 |
| Siberian Husky | 1.9 |
| Border Collie | 1.8 |
| Labrador Retriever | 1.7 |
| Whippet | 1.7 |
| Australian Cattle Dog | 1.5 |
| Airedale Terrier | 1.5 |
| Bichon Frise | 1.5 |
| Brittany Spaniel | 1.5 |
| Doberman Pinscher | 1.4 |
| Akita | 1 |
| Rottweiler | 1 |
| Mastiff | 0.8 |
| Australian Shepherd | 0.6 |
| Golden Retreiver | 0.6 |
| Boxer | 0 |
| Poodle | 0 |
| Portuguese Water Dog | 0 |
| Rhodesian Ridgeback | 0 |
| Havanese | 0 |
| Greyhound | 0 |
When it comes to dog aggression among certain breeds, we see an uptick in the percentage of each breed that earned the max score for aggression for snapping, biting, or attempting to bite another dog. All of the ones that made the top ten list had more than 15% of dogs in the breed earn a high score for aggression. Akitas were found to be the most aggressive toward other dogs, with 29.3% having earned the max score. The pit bull breed had 22% of dogs earn the max score for aggression, making pit bulls the second most aggressive dog breed toward other dogs.
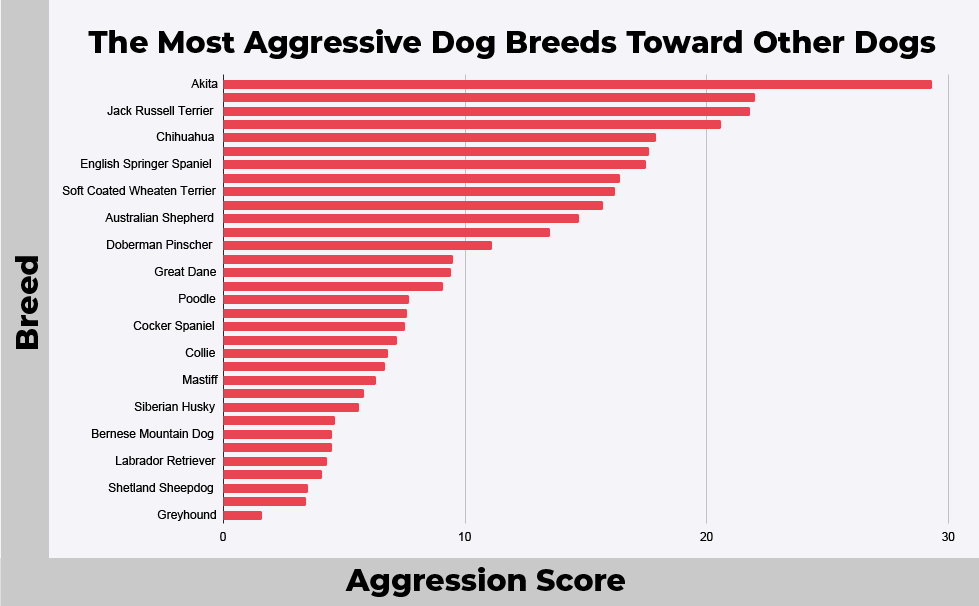
| Breed | Dog aggression score |
|---|---|
| Akita | 29.3 |
| Pit Bull | 22 |
| Jack Russell Terrier | 21.8 |
| Australian Cattle Dog | 20.6 |
| Chihuahua | 17.9 |
| Dachshund | 17.6 |
| English Springer Spaniel | 17.5 |
| German Shepherd | 16.4 |
| Soft Coated Wheaten Terrier | 16.2 |
| Boxer | 15.7 |
| Australian Shepherd | 14.7 |
| Border Collie | 13.5 |
| Doberman Pinscher | 11.1 |
| Beagle | 9.5 |
| Great Dane | 9.4 |
| Airedale Terrier | 9.1 |
| Poodle | 7.7 |
| Rottweiler | 7.6 |
| Cocker Spaniel | 7.5 |
| Golden Retreiver | 7.2 |
| Collie | 6.8 |
| Portuguese Water Dog | 6.7 |
| Mastiff | 6.3 |
| Rhodesian Ridgeback | 5.8 |
| Siberian Husky | 5.6 |
| Bichon Frise | 4.6 |
| Bernese Mountain Dog | 4.5 |
| Brittany Spaniel | 4.5 |
| Labrador Retriever | 4.3 |
| Havanese | 4.1 |
| Shetland Sheepdog | 3.5 |
| Whippet | 3.4 |
| Greyhound | 1.6 |
What is the least aggressive dog breed when it comes to strangers, their owners, and other dogs? The greyhound breed was found at the bottom of all three ranked lists, with none of the greyhounds in the study earning a high aggression score toward strangers or other dogs. There was a very low percentage of greyhounds that showed aggression toward their owners, with just 1.6% having earned the max score.
What dog has the strongest bite force? A study by the National Institute of Health analyzed the cranial size and shape of dogs with the strongest bite force to see what overlaps they could find. Results show that the bite force increases as size increases, which is a fair assumption. The effect the skull shape had on a dog’s bite force was found to be more significant in medium to large dogs. The skull shape of smaller dogs didn’t seem to have much effect on the force of their bite. According to the study, the following ten dog breeds were found to have the strongest bite force, measured in pounds per square inch (PSI).

The Kangal breed is the strongest dog breed in the world, so it came as no surprise that they were also found to have the strongest dog bite. These strong dogs were bred to be guard dogs and have an impressive 743 pounds per square inch of force behind every bite. Pit bulls’ bite force may only rank 19th on the list of dogs with the strongest bite force, but the 235 pounds per square inch bite force of pit bulls is the strongest of any dog in their size category.
Even with the large number of people that are bitten by a dog each year and require medical care, only a small percentage of these result in a dog bite-related fatality (DBRF). Of the 4.5 million dog bites in the U.S. each year, an average of 35 of them are fatal.
According to the data shared by the American Veterinary Medical Association on dog-bite-related fatalities over a period of 20 years, pit bulls are responsible for the most fatal dog attacks. A purebred or crossbreed pit bull was found to be responsible for 32% of the 238 DBRFs that occurred during this time period, nearly double that of rottweilers, which were responsible for the second most fatal dog attacks.
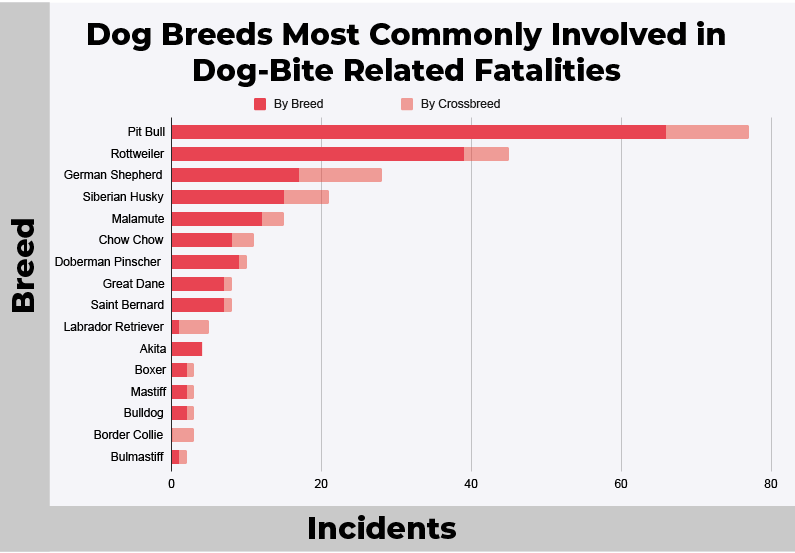
| Breed | Fatalities - purebred | Fatalities - crossbred | Total fatalities |
|---|---|---|---|
| Pit Bull | 66 | 11 | 77 |
| Rottweiler | 39 | 6 | 45 |
| German Shepherd | 17 | 11 | 28 |
| Siberian Husky | 15 | 6 | 21 |
| Malamute | 12 | 3 | 15 |
| Chow Chow | 8 | 3 | 11 |
| Doberman Pinscher | 9 | 1 | 10 |
| Great Dane | 7 | 1 | 8 |
| Saint Bernard | 7 | 1 | 8 |
| Labrador Retriever | 1 | 4 | 5 |
| Akita | 4 | 0 | 4 |
| Boxer | 2 | 1 | 3 |
| Border Collie | 0 | 3 | 3 |
| Mastiff | 2 | 1 | 3 |
| Bulldog | 2 | 1 | 3 |
| Bulmastiff | 1 | 1 | 2 |
What is the likelihood of being attacked and killed by a dog? Fatal dog attacks are fairly rare, with an average of 35 dog-bite-related fatalities occurring in the U.S. each year. Your odds of being killed by falling off a ladder or being struck by lightning are greater than the odds of a being killed by a dog. Here are some common occurrences that are more likely to kill you than a dog attack:
In this section, we’ll take a look at the most common demographics of dog bite victims. This data was collected by the CDC and is based on nonfatal dog-bite-related injuries that were treated in U.S. hospital emergency departments.
Children have a higher risk of being bitten by a dog, especially those under the age of 14. Children between the ages of 5 and 9 made up 15.2% of all nonfatal dog-bite-related injuries treated at the emergency room, while children between the ages of 0-4 and 10-14 each made up just more than 13% of those treated. Not only are children more likely to be bitten by a dog, but they are also more likely to have serious injuries resulting from the bite due to their small size. The ages of adults being treated for dog bites at the emergency room span from 20 to over 65, although older adults were less likely to be bitten than younger adults. The highest numbers of adult dog bite victims fell between the ages of 25 and 44.

The gender that is more likely to be bitten by a dog is males, although not by much. A male patient was treated at the ER in 55.1% of dog bite cases, while a female patient was treated for a dog bite injury in 44.9% of the cases.

The most common part of the body for a dog bite is on the arm or hand, followed by a bite on the leg or foot and the head or neck area. Dog bites on the arm and hand account for nearly half of the nonfatal dog-bite-related injuries that were treated at the ER.

Although fatal dog bites are rare, there are certain actions and factors that can provoke a dog to attack and lead to a majority of the 466 dog-bite-related fatalities that occurred between 2000 and 2015. Four or more of the following preventable factors were present in 75.5% of the DBRFs that took place during this time:
One aspect of being a dog owner is being held liable for your dog’s actions, especially if they injure or kill someone. Between 2013 and 2022, the number of dog bite claims made to insurance companies has remained steady while the average cost of a dog bite claim has risen dramatically, nearly doubling during this time. Let’s compare the cost of a dog bite claim in 2013 to the cost of a dog bite liability claim submitted to insurance companies a decade later in 2022.
The total value of dog bite claims has increased by 134.9% since 2013, while the number of dog bite claims has only increased by 1.4% during this time. Due to this huge increase in value, the cost per claim has increased each year to the point where the average payout for a dog bite claim was 131.7% higher in 2022 than it was in 2013.

Some insurance companies have banned certain dog breeds from being covered by homeowners’ insurance. They have blacklisted specific breeds based on several factors, one of which is the likelihood of that dog breed biting a person or another animal.
Pit bulls and Rottweilers are the two most notorious dog breeds for being banned by insurance companies, and some places in the U.S. have even enacted breed-specific laws and regulations against them. Which dog breeds are a type of pit bull? Insurance companies define the following dog breeds as pit bulls: bull terriers, Staffordshire bull terriers, American bull terriers, American Staffordshire terriers, or any combination of these breeds.

This is not to say that all home insurance providers ban dog breeds. There are some insurance companies that will cover banned breeds, which is why it remains important to check the conditions of insurance before signing any contracts.
There were 17,583 dog bite claims made to insurance companies in the United States in 2022, with more than half of the dog bite claims (9,393) coming from just the top 10 states. California topped the list with 1,954 dog bite claims, the highest of any state by a wide margin. Their number of claims was far greater than Texas, even though Texas has half a million more dogs than California.

Dog bite insurance claims have skyrocketed in 2022 compared to previous years. California, for example, went from an average cost per claim of $59,561 to $78,818. The U.S. state average dog bite claim per bite was $64,555.

Each of the states has its own set of dog bite statutes that govern dog bite liability, although they all fall within three categories: one-bite states, statutory strict liability states, and mixed dog bite law states. A one-bite law means that a dog owner is only held liable for injuries caused by a bite from their dog if they knew there was a possibility that their dog might bite. Statutory strict liability means that the dog owner is held liable if their dog bites someone, regardless of whether the owner knew the dog might bite. There are some exceptions to statutory strict liability, though, including cases where the victim:
Several states have a mixed dog bite statute, incorporating the one-bite rule into their strict liability laws based on certain exceptions. For example, in Tennessee, the dog bite statute only applies if the bite occurred outside of the owner’s property (with some exceptions), and Oregon’s dog bite statute only covers medical bills for dog bite treatment and loss of income.

While 4.5 million dog bites in the U.S. each year sounds like a lot, remember that dog bite prevention is possible in most cases. There are certain things one can do near a dog to prevent the situation from escalating to the point of being attacked and bitten by a dog. Dog owners also have a responsibility to ensure that their dog will not bite others by training and caring for them properly. Below is a list of steps that can be taken to avoid having a negative interaction with a dog and possibly getting bitten.
We hope you’ll take what you learned here and apply it to any situation you may be in with a dog to ensure that it is a safe and comfortable atmosphere for everyone involved. It’s important to remember that a dog of any size, age, or breed can bite, not just the large and powerful ones!
Published on by Matthew H. Nash

Social media culture has permanently shaped how we all live and exist in the world. For some, social media has provided new opportunities, insights into new ways of living, and even new career paths. For others, it has created a culture of comparison, envy, and dangerous behavior.
We initially became interested in the idea of risk aversion versus risk tolerance regarding social media while studying the sharp uptick in selfie-related deaths being reported in the news. It seems like this is becoming a more and more common occurrence, but was it actually? What are the numbers behind the headlines?
We compiled a database of 314 selfie-related incidents from March 2014 through June 2024. This database is a continuation of the Wikipedia selfie-related injuries and deaths database, which has largely stopped updating in the last couple of years.
These incidents in our database account for 425 selfie deaths and 82 injuries spanning 49 countries.
All of the following incidents were reported as being directly related to taking a selfie as the cause of death, as reported by the media. This does not factor in the countless deaths that were peripherally related to taking a selfie or were selfie-related, but that could not be verified as such during the autopsy or at the crime scene. Odds are, the number of selfie-related deaths and injuries is likely much higher.
We noticed the list of selfie-related deaths on Wikipedia was not being updated, so we decided to take matters into our own hands and compile a comprehensive database. Our list has been expanded and is more user-friendly, as well as updated as of June 2024. The article titles have been translated from their original language into English where applicable.

It's one thing to know that selfie deaths and injuries are happening "somewhere" in the world, but many treat it as a modern boogeyman story. "Don't get too close to the ledge, or you could fall off!" Stories of selfie deaths are sensationalized in the media and framed as rare occurrences. But are they? How often are selfie deaths really happening, where do they occur, and how can we avoid these incidents?
As stated in the intro, there have been documented:
India is the country with the most selfie-related deaths and injuries, with a total of 190 deaths (47% of all total deaths) and 55 injuries. Next is the United States, with 29 deaths, and Russia, with 18 deaths.

| Country | Deaths | Injuries |
|---|---|---|
| India | 190 | 55 |
| USA | 29 | 5 |
| Russia | 18 | 1 |
| Pakistan | 16 | 0 |
| Brazil | 8 | 4 |
| Spain | 8 | 2 |
| Australia | 8 | 0 |
| Italy | 6 | 0 |
| Philippines | 5 | 0 |
| Kenya | 12 | 0 |
| Turkey | 6 | 0 |
| United Kingdom | 4 | 1 |
| Indonesia | 12 | 0 |
| Sri Lanka | 5 | 1 |
| Greece | 4 | 0 |
| Thailand | 4 | 1 |
| Zimbabwe | 4 | 0 |
| Croatia | 3 | 2 |
| Mexico | 4 | 0 |
| Colombia | 3 | 0 |
| Nepal | 3 | 0 |
| Portugal | 4 | 0 |
| China | 3 | 0 |
| Germany | 3 | 0 |
| Vietnam | 3 | 0 |
| Belgium | 2 | 0 |
| Chile | 2 | 0 |
| Hong Kong | 2 | 0 |
| Hungary | 2 | 0 |
| Norway | 2 | 0 |
| Peru | 2 | 0 |
| Ukraine | 2 | 0 |
| Canada | 3 | 0 |
| Nigeria | 2 | 2 |
| Oman | 2 | 0 |
| Bangledesh | 1 | 0 |
| France | 1 | 0 |
| Ireland | 1 | 0 |
| Lithuania | 1 | 0 |
| Malaysia | 1 | 0 |
| New Zealand | 1 | 0 |
| Panama | 1 | 0 |
| Romania | 1 | 1 |
| Serbia | 1 | 0 |
| Slovenia | 1 | 0 |
| Malta | 1 | 0 |
| South Africa | 1 | 0 |
| Uganda | 1 | 0 |
| Montenegro | 0 | 1 |
Of course, total death and injury rates are only part of the story. Total incidents are a way to give us insights into where these issues are occurring, how, and when. Many incidents occurred as standalone occurrences with only one victim, but many involved multiple victims, particularly friends or family members who attempted to aid the person who was injured.

| Type of Incident | Fatalities | Number of Incidents |
|---|---|---|
| Drowning | 146 | 58 |
| Falls | 130 | 124 |
| Train | 60 | 45 |
| Other | 21 | 18 |
| Firearm | 13 | 13 |
| Elephants | 11 | 11 |
| Animal (Other) | 9 | 8 |
| Car Accidents | 7 | 6 |
Falls account for 44% of selfie-related incidents, followed by drowning at 21% and trains at 16%. However, drowning is the #1 cause of fatalities since oftentimes multiple people die while trying to save others.
"Other" includes people attempting to take selfies with lightning, near helicopters, on the wing of a plane, holding a grenade, riding a bicycle, and more. The vast majority of incidents involved attempting to take a picture at a height or by a cliff and falling, or trying to take a photo in or near the water and drowning.

| Year of Incidents | Number of Incidents |
|---|---|
| 2023 (through July) | 14 |
| 2022 | 30 |
| 2021 | 33 |
| 2020 | 8 |
| 2019 | 19 |
| 2018 | 24 |
| 2017 | 41 |
| 2016 | 63 |
| 2015 | 37 |
| 2014 | 16 |
Selfie-related death and injury news reports appear to have peaked in 2016 and have decreased somewhat since then. In fact, over 23% of all selfie deaths occurred in just 2016 alone. The fact that these incidents appear to be decreasing is great news. However, it makes you wonder if the incidents have actually stopped happening as frequently, or if the reporting has. It's possible that it’s no longer sensationalized and has become normal to the point of no longer requiring national or international news, or we've possibly just accepted this as a regular part of life and death on the internet.
Other possible explanations for this decrease in selfie deaths include:
Another possibility is that social media sites, like Instagram and TikTok, have increased their community monitoring and now censor risky material more than they did previously, potentially due to backlash or liability.
Selfie-related deaths and accidents are a global problem, but they do seem to be happening in certain places more than others. We wouldn’t presume to definitively know the reason behind this, but certain factors likely include:

| Country | Selfie-Related Incidents |
|---|---|
| India | 111 |
| USA | 27 |
| Russia | 14 |
| Brazil | 9 |
| Pakistan | 9 |
| Spain | 9 |
| Australia | 8 |
| Italy | 6 |
| Kenya | 5 |
| Philippines | 5 |
| Turkey | 5 |
| United Kingdom | 5 |
| Greece | 4 |
| Indonesia | 4 |
| Sri Lanka | 4 |
| Thailand | 4 |
| Zimbabwe | 4 |
| Colombia | 3 |
| Croatia | 3 |
| Mexico | 3 |
| Nepal | 3 |
| Belgium | 2 |
| Chile | 2 |
| Germany | 2 |
| Hong Kong | 2 |
| Hungary | 2 |
| Norway | 2 |
| Peru | 2 |
| Portugal | 2 |
| Romania | 2 |
| Ukraine | 2 |
| Vietnam | 2 |
| Bangledesh | 1 |
| Canada | 1 |
| France | 1 |
| Ireland | 1 |
| Lithuania | 1 |
| Malaysia | 1 |
| New Zealand | 1 |
| Nigeria | 1 |
| Oman | 1 |
| Serbia | 1 |
| Slovenia | 1 |
| South Africa | 1 |
| Uganda | 1 |
"Where" is only part of the equation; however, when you factor in tourists and the prevalence of selfie incidents while traveling. In fact, 17.83%, or 51 of the 286 incidents, included people who were traveling or visiting another country. The idea of tourists behaving in risky or dangerous ways is not necessarily a new phenomenon, but it is of note when discussing selfie incidents.

When social capital is tied to observable metrics (i.e., “likes” and “comments”) and is no longer limited to your immediate friends and family, it can feel like the goalpost for social approval keeps getting more extreme and more global. Teenagers and adults aren't just comparing themselves to their friends and classmates. They are now being compared to unrealistic beauty standards, increasingly high-risk behavior, and a worldwide community of peers. There's even an academic term for the phenomenon: PIGU (Problematic Instagram Use).
Social media companies are likely well aware of the impact that their platforms have on young people. Many people feel like the platforms are willfully or negligently ignoring the impacts on youth. In fact, they have actively downplayed the devastating psychological effects of their platforms on young people for the sake of profit, according to the Wall Street Journal.
It’s clear to see how things like dangerous health fads, risky social media trends, and toxic body image can be harmful to young people. But what about more innocent-seeming trends, like travel bloggers and nature enthusiasts? Are these forms of social media “safer” when they tacitly cosign dangerous behavior? To what extent does influencer culture promote and encourage risky behavior in the pursuit of attention and social media clout?
We asked these questions and more in our original research study, "Death by Instagram-fueled selfies: a survey of 1,233 Instagram users (2023)" on risky social media behaviors, and found that at least 1 in 10 Instagrammers would willingly put themselves at risk for more followers. This percentage only increased when users were more active and engaged on social media.

In the short lifespan of social media apps, what’s considered “Instagrammable” has shifted dramatically from brunch with friends and beautiful sunsets to dangerous vacations in exotic places. While Instagram is often credited with popularizing potentially risky behavior for social media, apps like Snapchat, Reddit, and TikTok also regularly feature dangerous stunts and trends that are keeping young people interested (but not necessarily safe).
We don’t know how far apps like TikTok and Instagram will push the boundaries of human behavior and relationships. But we do know that social media apps were designed to hold our focus and keep us seeking the validation of “likes" and attention. And they were designed very, very well.
To keep The Swiftest a free online resource, we may receive advertising/referral fees when you buy a pet insurance policy through links on this page. Our extensive, unbiased research of each insurance provider, and how they compare against each other also influences the rankings. We do not feature every insurance product on the market, rather we only showcase the most trusted insurance providers. Listings on this page do not imply endorsement. Learn more on our Terms of Service page.